
Monitoring Loadbalancer.org appliances using OmniCenter from Netreo
Application Management Published on •3 mins Last updated
Recently at Loadbalancer.org, we have been looking at monitoring software to pair with our load balancer appliance. We came across a company called Netreo who make the OmniCenter product. This is going to be a blog to tell you about the appliance and a little bit about what it can do.
What is Netreo OmniCenter?
OmniCenter is a server monitoring, alerting & reporting product which can be deployed to monitor your whole network/infrastructure, providing a single place to view of all systems and alerting you if there are any problems. This allows you the peace of mind knowing that proactive action can be taken to prevent situations occuring, but if for some reason they do, the appropriate team can be notified which allows them to be reactive to fix the issue ASAP and will alert you if there are any problems. The idea is to provide "a unified single view into virtually all IT components, from end-user application experience to device-level performance and capacity planning." As mentioned on the Netreo OmniCenter website.
OmniCenter can monitor both physical or virtual appliances and works great with many products/applications/environments and benefits from features such as automated mapping, cloud mapping, fault monitoring and data collecting. But in this blog, we are going to talk about how it works with our Enterprise VA MAX appliance.
How do you use Netreo OmniCenter to monitor our load balancer?
You need to manually enter the device details of the load balancer to connect it to the OmniCenter appliance so that it can be monitored. To ensure that load balancer is picked up by the OmniCenter, you need to enter the following:
- IP address of the load balancer
- Root login credentials
- SNMP community string
You should then see this overview screen:
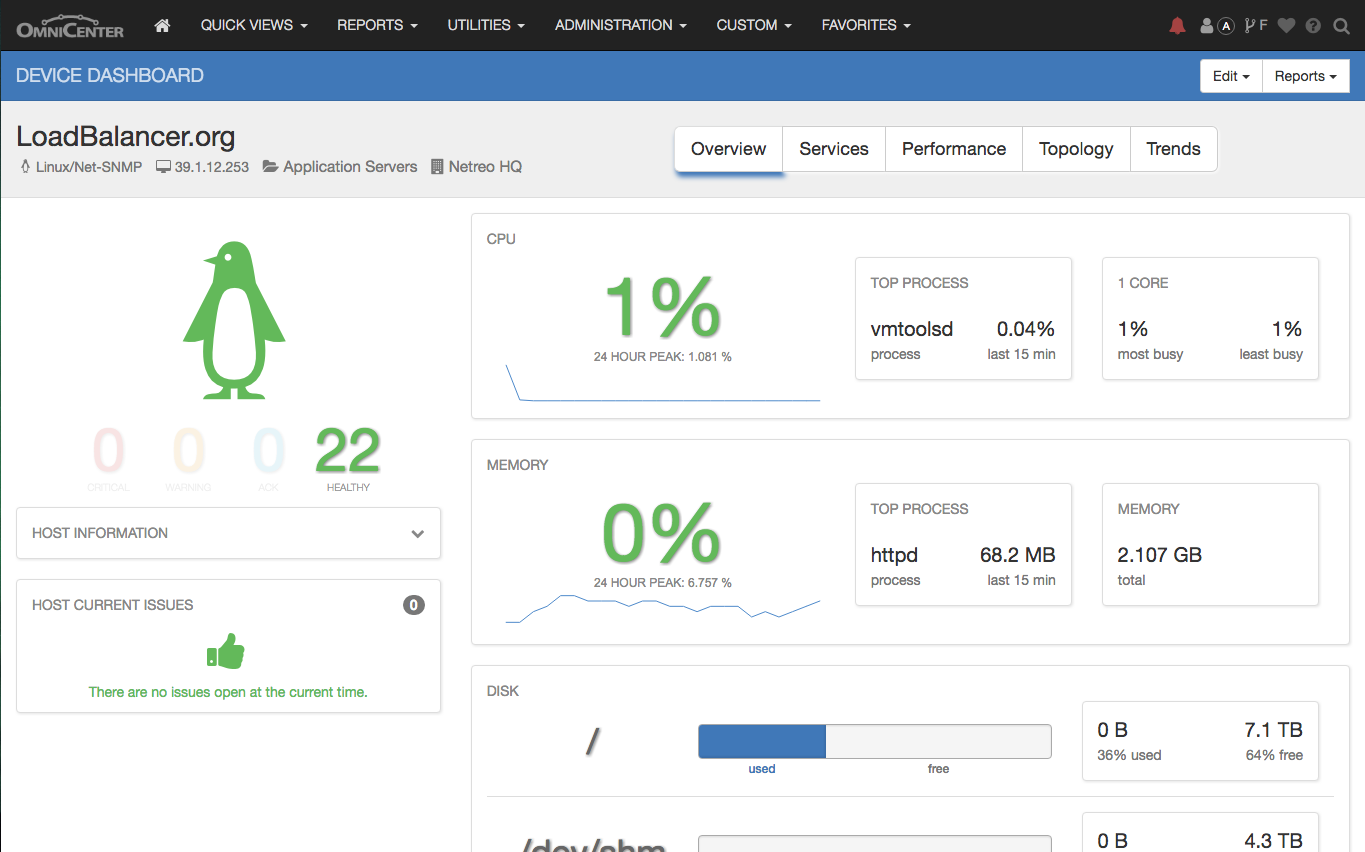
This is a simple overview of the load balancer product/instance, it presents you with your CPU and memory usage, disk usage, where your appliance is and what IP it is using. The OmniCenter can also show you your top process broken down by different metrics, i.e. "top process for memory usage is httpd" or "top process for CPU usage is vmtoolsd". You also get an icon depending on what operating system you are using. In this case, we are using Linux so we have a penguin icon.
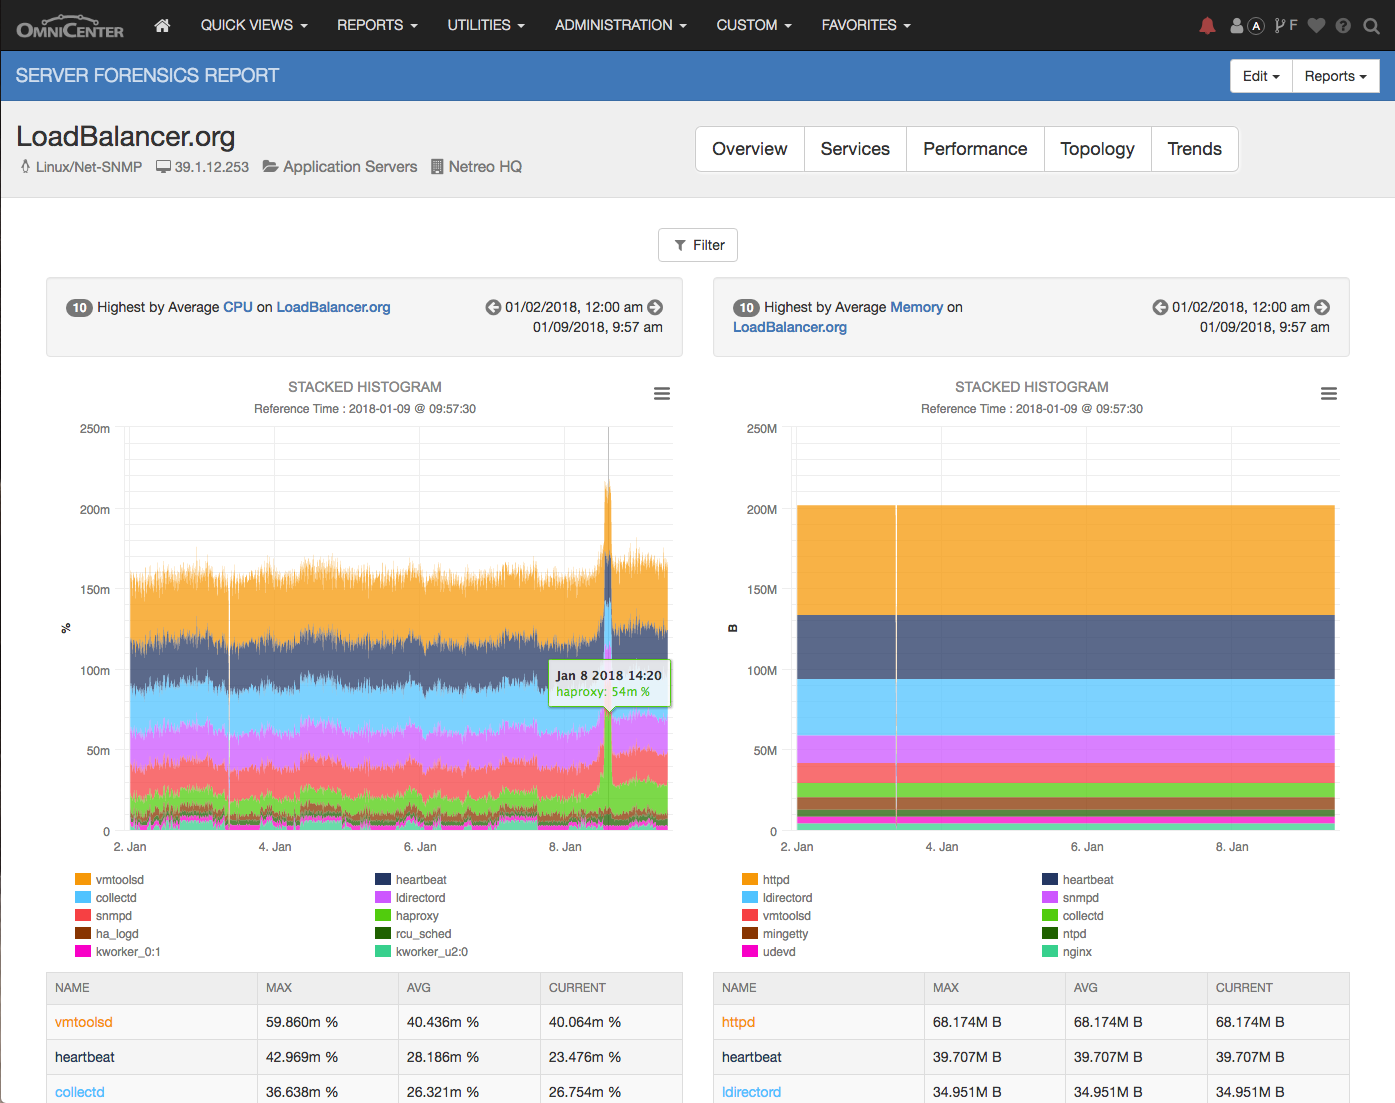
This is a screenshot of the graphs of CPU usage and memory usage and what it is being used on. This would be really useful if you have a slow server somewhere in your deployment that is slowing everything down but you do not know which server it is. If you link the whole deployment onto the OmniCenter you will be able to see exactly which server it is and what the CPU/memory is getting used on. You are also able to make sure that the network is still up and running by making the OmniCenter run regular checks between each link. This could be a ping check or a connect to port check. There are many other methods available and if you wish to learn more contact Netreo to discuss their OmniCenter.
This blog is Loadbalancer.org based (for obvious reasons) but I should also mention that the OmniCenter can also monitor web servers, cloud servers, routers and mail servers. The OmniCenter is a lot more powerful than this blog shows and has a lot more features we didn't manage to explore.
If you want to find out more you can check out the OmniCenter by Netreo by following this link.