In today's web landscape, maintaining both security and performance is key. As traffic grows and security threats become more sophisticated, tools like HAProxy and ModSecurity have become essential for web infrastructure.
HAProxy is an open-source reverse proxy and load balancer that helps you distribute traffic across multiple servers, improving availability and scalability.
ModSecurity is an open-source, cross-platform Web Application Firewall (WAF) engine designed for Apache, IIS, and NGINX.
When integrated with Apache, ModSecurity leverages its powerful event-based programming language to safeguard your web applications from common threats like SQL injection, cross-site scripting (XSS), and other attacks. Additionally, it enables comprehensive HTTP traffic monitoring, logging, and real-time analysis to bolster your application’s security.
While HAProxy helps manage traffic flow, and ModSecurity shields you from web-based attacks, it’s equally important to monitor these systems.
By keeping an eye on logs, you can quickly detect potential security threats, track performance issues, and maintain a healthy, secure infrastructure.
This is where tools like Graylog, ELK Stack, and Loki + Grafana come in, to help you monitor and analyse logs in real time.
*Spoiler* We don't necessarily recommend one solution over another here. They are all great tools with potential pros and cons, and the most suitable solution will depend on your specific needs.
Table of contents
- Why log monitoring matters
- When to use Graylog
- When to use the ELK Stack
- When to use Loki and Grafana
- How to set up Apache with ModSecurity and HAProxy
- How to install and configure the ELK Stack
- How to install and configure Graylog
- How to install and configure Loki and Grafana
- How to detect security issues with the ELK Stack
- How to detect security issues with Graylog
- How to detect security issues with Loki and Grafana

Why log monitoring matters
Monitoring logs is critical for two main reasons:
- Security: ModSecurity logs can alert you to potential attacks, helping you stay one step ahead of hackers. By regularly checking these logs, you can detect and respond to malicious activities before they become major incidents.
- Performance: ModSecurity logs offer insights into traffic patterns, server load, and potential performance bottlenecks. By monitoring these logs, you can ensure your load balancing setup is working optimally, and that no single server is getting overloaded.
Now, let’s dive into three powerful monitoring tools—Graylog, ELK Stack, and Loki + Grafana—that will help you stay on top of both security and performance.
When to use Graylog
Why use Graylog?
- Graylog is a powerful, easy-to-use tool for centralising and managing your logs. It's perfect if you want to collect, analyse, and visualise logs from multiple services—like HAProxy and ModSecurity—in real time.
- With Graylog, you get an intuitive interface where you can set up dashboards, create alerts, and search through logs quickly. It’s great for gaining insight into both the security of your system (via ModSecurity logs) and performance metrics (from HAProxy).
How easy is it to set up Graylog?
- Graylog is relatively easy to set up, with pre-built Docker images and straightforward installation guides. Its web-based UI is user-friendly, so you can start working with your logs almost immediately.
- Once configured, it easily integrates with HAProxy and ModSecurity to provide a real-time view of your traffic and security logs.
Graylog pros:
- Real-time log monitoring and analysis.
- Easy to use, with a web-based dashboard.
- Customizable alerts to notify you of critical events (security incidents or performance issues).
- Scalable for managing large amounts of log data.
Graylog cons:
- Some advanced features, like log parsing, may require plugins.
- It can take time to fully understand how to use complex features, like custom alerting or advanced search queries.
When to use the ELK Stack
Why use the ELK Stack (Elasticsearch, Logstash, and Kibana)?
- The ELK Stack—made up of Elasticsearch, Logstash, and Kibana—is a heavy-duty log management solution. It's great for teams that need to collect and analyse large volumes of logs, providing deep insights through powerful search and detailed visualisations.
- Logstash can be set up to collect logs from HAProxy and ModSecurity, process them, and send them to Elasticsearch, where you can then visualise them in Kibana’s beautiful, customizable dashboards.
How easy is it to set up the ELK Stack?
- The ELK Stack is more complex than other solutions because it involves multiple components. That said, Docker images and guides make it easier to install.
- For a simpler setup, you can use Filebeat to collect logs directly from HAProxy and ModSecurity, skipping the need for Logstash.
ELK Stack pros:
- Incredible visualisations and search capabilities through Kibana.
- Scalable for large environments and high volumes of logs.
- Highly customizable and flexible—ideal if you want to fine-tune your monitoring setup.
- Strong community support and extensive documentation.
ELK Stack cons:
- Requires more resources and is more complex to configure.
- Multiple components (Elasticsearch, Logstash, Kibana) need to be set up and managed, which can be time-consuming.
When to use Loki and Grafana
Why use Loki and Grafana?
- Loki is a lightweight, cost-effective log aggregation tool designed to integrate seamlessly with Grafana. Unlike other solutions, Loki doesn’t index full log content—just the metadata—making it highly efficient and scalable, especially for high-volume environments.
- When paired with Grafana, you get an intuitive interface where you can create dashboards that combine both logs and metrics. This is especially useful if you’re already using Grafana to monitor system metrics (e.g., CPU, memory, or traffic load from HAProxy).
How easy is it to set up Loki and Grafana?
- Loki is designed to be simple. If you’re already using Grafana, integrating Loki for log management is a natural extension.
- Setting up Promtail (the agent that ships logs to Loki) is straightforward and works well with both HAProxy and ModSecurity logs.
Loki and Grafana pros:
- Lightweight and efficient log aggregation.
- Seamless integration with Grafana, giving you unified dashboards for logs and metrics.
- Easy to scale and manage, especially in large environments.
- Perfect if you're already familiar with Grafana and looking to add log monitoring to your existing dashboards.
Loki and Grafana cons:
- Not as feature-rich as ELK Stack for advanced log searching and filtering.
- Logs are stored with minimal indexing, which can limit complex querying.
How to set up Apache with ModSecurity and HAProxy
1. Set up Apache with ModSecurity (WAF)
This has been done on Ubuntu 24.04 (as of writing of this blog these are the latest packages available from the Ubuntu repo.)
Before installing anything we will need to make sure that the packages are up to date:
sudo apt update && sudo apt upgrade -yNow let’s install apache (version 2.4.58):
sudo apt install apache2 -yInstall ModSecurity for Apache (version 2.9.7 -1build3):
sudo apt install libapache2-mod-security2 -yEnable the ModSecurity module:
sudo a2enmod security2
2. Configure ModSecurity with OWASP Core Rule Set (CRS)
Download and install the OWASP Core Rule Set 4.9.0:
cd /etc/modsecurity
sudo apt install git -y
sudo git clone https://github.com/coreruleset/coreruleset.git
Copy the example CRS configuration file:
sudo cp /etc/modsecurity/coreruleset/crs-setup.conf.example /etc/modsecurity/coreruleset/crs-setup.confEdit the Apache ModSecurity configuration file to include the CRS rules:
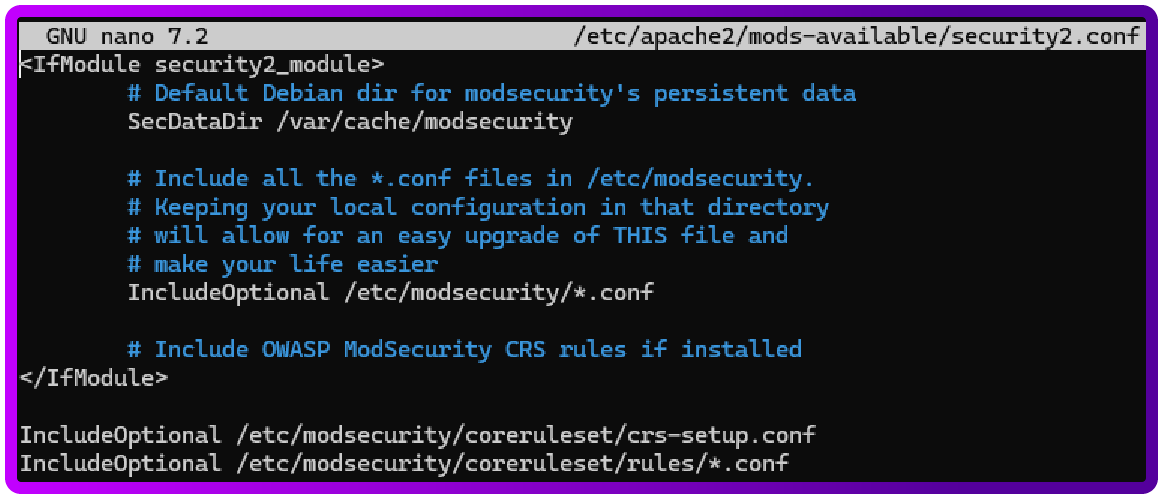
sudo nano /etc/apache2/mods-available/security2.conf
Remove this line:
IncludeOptional /usr/share/modsecurity-crs/*.loadAnd add:
IncludeOptional /etc/modsecurity/coreruleset/crs-setup.conf
IncludeOptional /etc/modsecurity/coreruleset/rules/*.conf
It should look like this:
Save and exit (Ctrl + X , then Y and press Enter)
Lastly you will need to move the recommended config to this location and rename it like below:
sudo mv /etc/modsecurity/modsecurity.conf-recommended /etc/modsecurity/modsecurity.confNow let’s do a restart of the service:
sudo systemctl restart apache2
Let’s also double check that Apache is running and not having any errors:
sudo systemctl status apache23. Configure Apache to Forward Traffic to HAProxy
Apache will be listening on port 80 and will forward traffic to HAProxy on 8080.
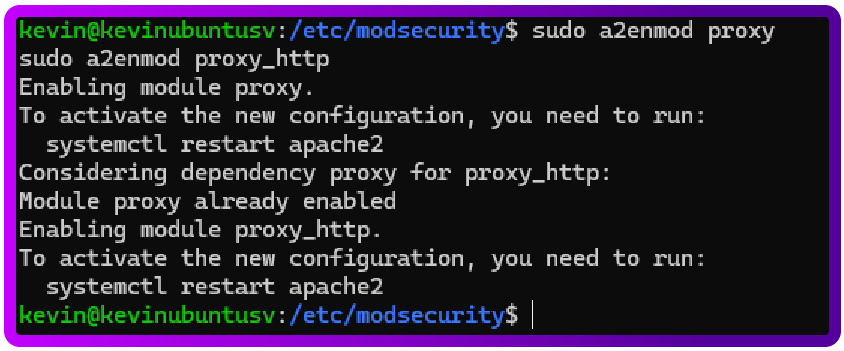
To forward traffic, Apache needs to have the proxy modules enabled:
sudo a2enmod proxy
sudo a2enmod proxy_http
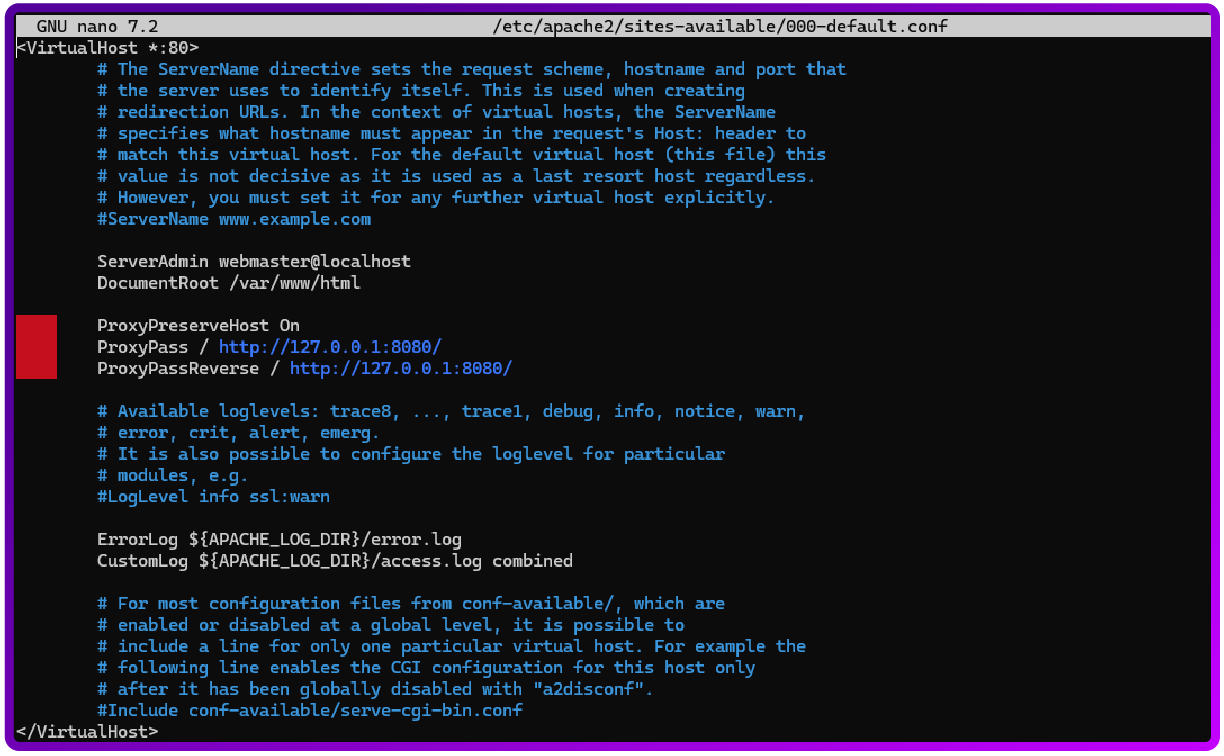
Next we will need to modify the default Apache virtual host to forward traffic to HAProxy, which will listen on port 8080.
sudo nano /etc/apache2/sites-available/000-default.confAdd the following lines like below:
ProxyPreserveHost On
ProxyPass / http://127.0.0.1:8080/
ProxyPassReverse / http://127.0.0.1:8080/
sudo systemctl restart apache2
sudo systemctl status apache2

4. Install and configure HAProxy
Let’s install HAProxy version 2.8.5-1ubuntu3:
sudo apt install haproxy -yNext open the main configuration file for HAProxy:
sudo nano /etc/haproxy/haproxy.cfg
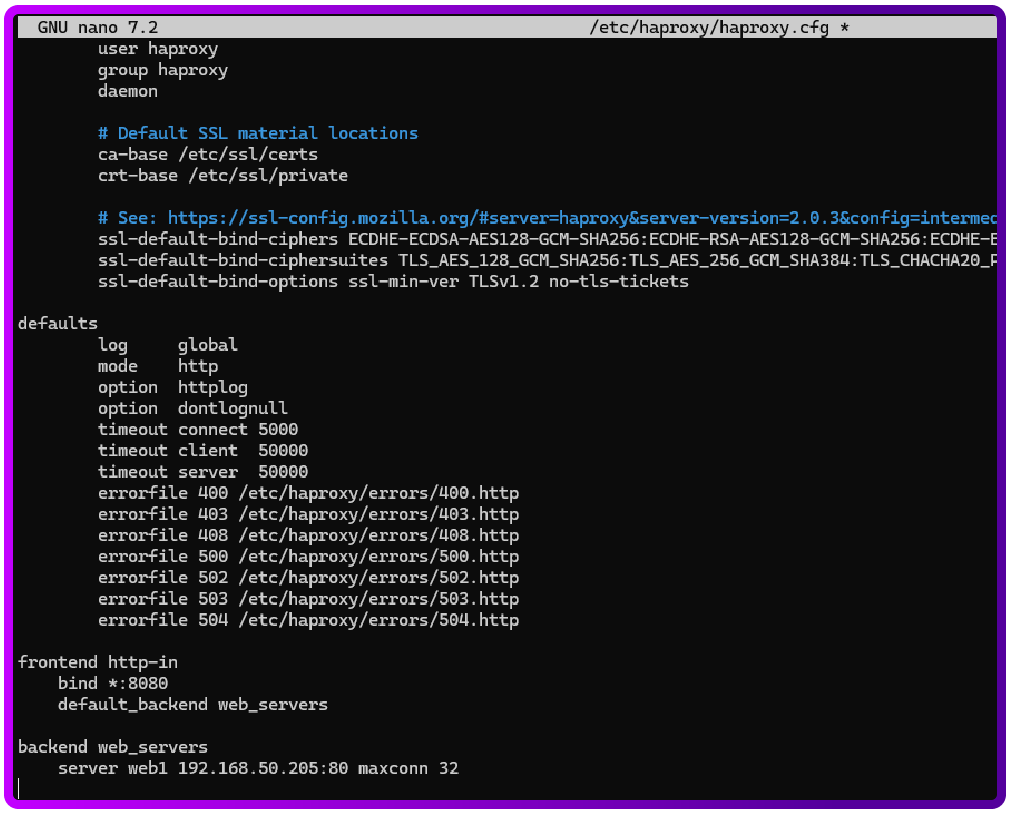
HAProxy will be listening on port 8080 and forwarding traffic to your backend server/servers on, in this example case: 192.168.50.205:80.
Add the following section to your haproxy.cfg file:
frontend http-in
    bind *:8080
    default_backend web_servers

backend web_servers
    server web1 192.168.50.205:80 maxconn 32
Save and exit (Ctrl + X , then Y and press Enter)
- frontend http-in: HAProxy listens on port 8080 (where Apache sends traffic to).
- backend web_servers: HAProxy forwards traffic to your backend servers
Restart HAProxy to apply the configuration changes and enable it to start with the system:
sudo systemctl restart haproxy
sudo systemctl enable haproxy
Also let’s check to make sure haproxy is working properly:
sudo systemctl status haproxyTo test the environment we can run this command which simulates a SQL attack:
curl "http://yourwebserverip/?param=1%20OR%20%271%27=%271"
And have a look at the logs:
sudo tail -f /var/log/apache2/modsec_audit.log
We should see something like this:

If you want to actively block attacks, you can switch ModSecurity to blocking mode by editing the modsecurity.conf file:
Open the configuration file: sudo nano /etc/modsecurity/modsecurity.conf
- Open the configuration file: ` sudo nano /etc/modsecurity/modsecurity.conf `
sudo nano /etc/modsecurity/modsecurity.conf- Find the following line:
SecRuleEngine DetectionOnly- Change it to:
SecRuleEngine OnIt is recommended to wait until doing so, so we can fully set it up and make sure it's working the way we expect it to.
Next, we'll outline how to install and configure the three monitoring tools.
How to install and configure the ELK Stack
Prerequisites
Update system packages:
sudo apt update && sudo apt upgrade -yEnsure Java is installed: Elasticsearch and Logstash require Java. Install it if not already present
sudo apt install -y openjdk-11-jdkElasticsearch install and configuration
Add Elasticsearch Repository:
wget -qO - https://artifacts.elastic.co/GPG-KEY-elasticsearch | sudo apt-key add -
echo "deb https://artifacts.elastic.co/packages/7.x/apt stable main" | sudo tee -a /etc/apt/sources.list.d/elastic-7.x.list
sudo apt update
Install Elasticsearch version 7.17.25 :
sudo apt install elasticsearch -yConfigure Elasticsearch:
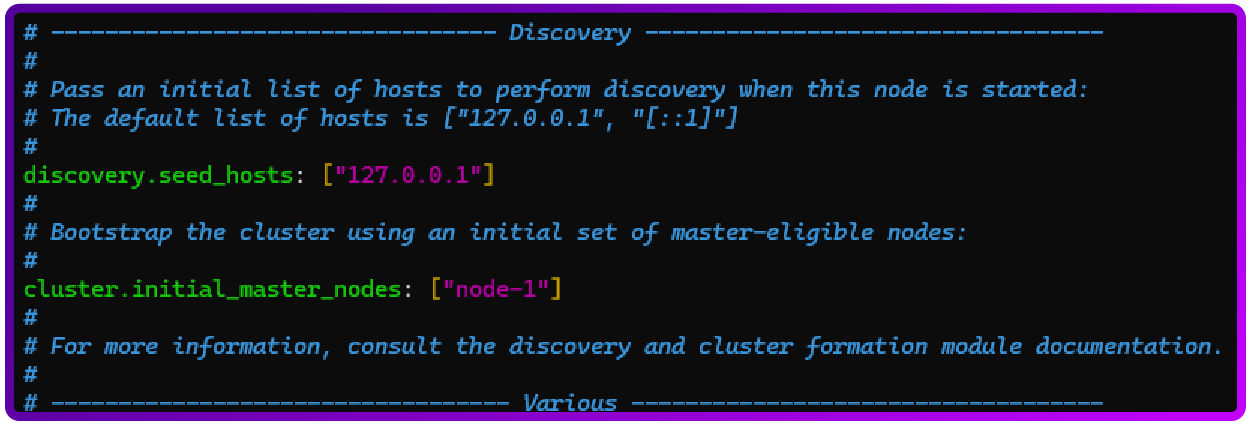
sudo nano /etc/elasticsearch/elasticsearch.ymlAnd you will need to uncomment and set the following lines as shown below:
node.name: node-1
network.host: 0.0.0.0
http.port: 9200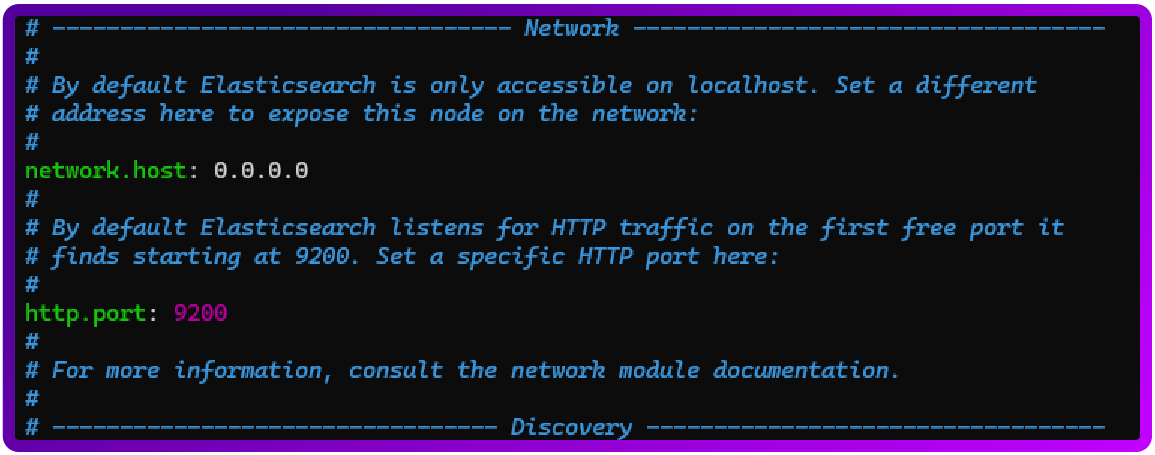
discovery.seed_hosts: ["127.0.0.1"]
cluster.initial_master_nodes: ["node-1"]
You can now Start and Enable Elasticsearch to start with the system:
sudo systemctl start elasticsearch
sudo systemctl enable elasticsearch
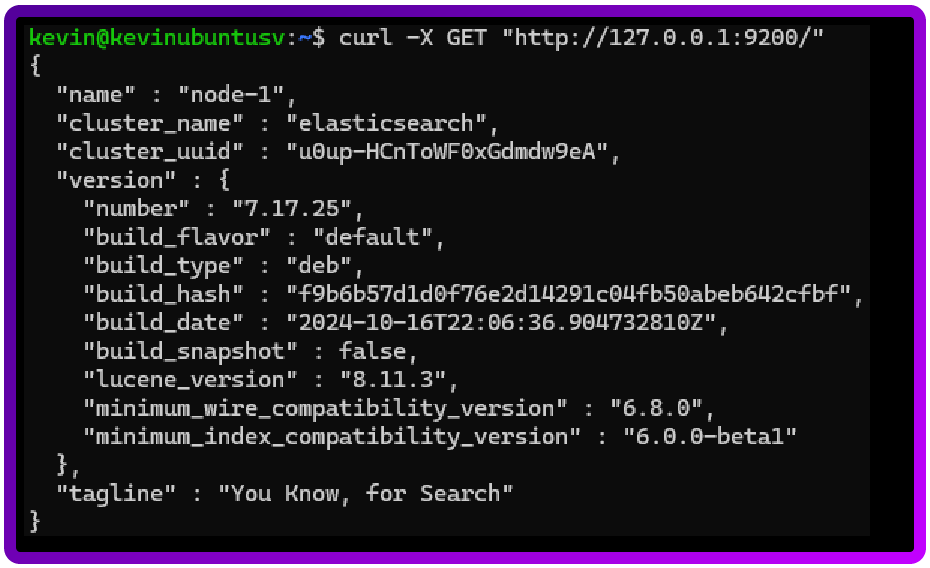
Let’s test and see if Elasticsearch is running as expected:
curl -X GET "http://127.0.0.1:9200/"
We want to look for is the phrase “You Know, for Search” like below:
Logstash install and configuration
Install Logstash version 1:7.17.25-1 :
sudo apt install logstash -y
Create a configuration file for ModSecurity logs:
sudo nano /etc/logstash/conf.d/modsecurity.conf
Add the following configuration:
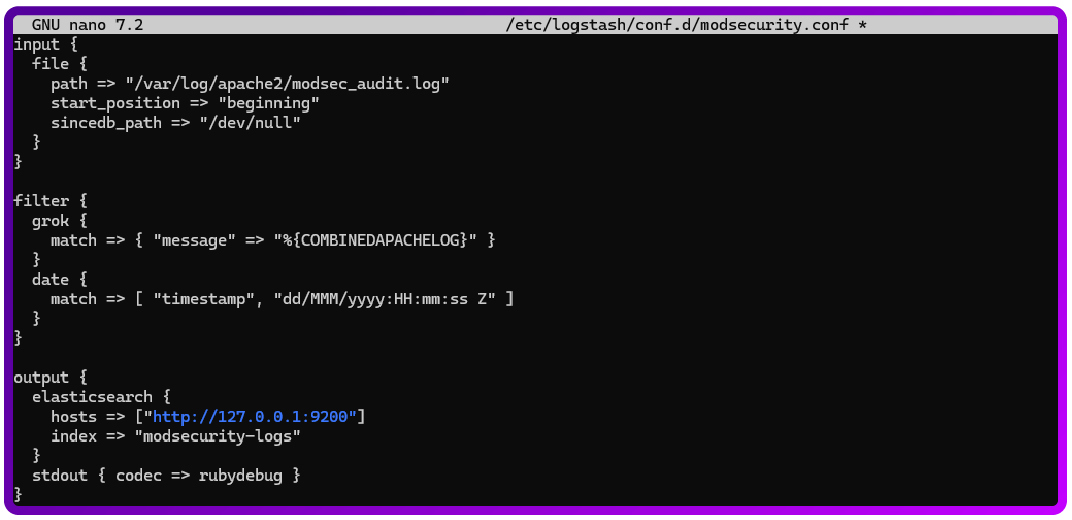
input {
  file {
    path => "/var/log/apache2/modsec_audit.log*"
    start_position => "beginning"
    sincedb_path => "/dev/null"
  }
}

filter {
  grok {
    match => { "message" => "%{COMBINEDAPACHELOG}" }
  }
  date {
    match => [ "timestamp", "dd/MMM/yyyy:HH:mm:ss Z" ]
  }
}

output {
  elasticsearch {
    hosts => ["http://127.0.0.1:9200"]
    index => "modsecurity-logs"
  }
  stdout { codec => rubydebug }
}
To Start and Enable Logstash to start with the system:
sudo systemctl start logstash
sudo systemctl enable logstash
Verify Logstash: Run Logstash manually to test, this should output raw logs in real time. To exit, hit Ctrl + C
sudo /usr/share/logstash/bin/logstash -f /etc/logstash/conf.d/modsecurity.confKibana install and configuration
Install Kibana version 7.17.25 :
sudo apt install kibana -yEdit the configuration file:
sudo nano /etc/kibana/kibana.ymlAdd the following:
server.host: "0.0.0.0"
elasticsearch.hosts: ["http://127.0.0.1:9200"]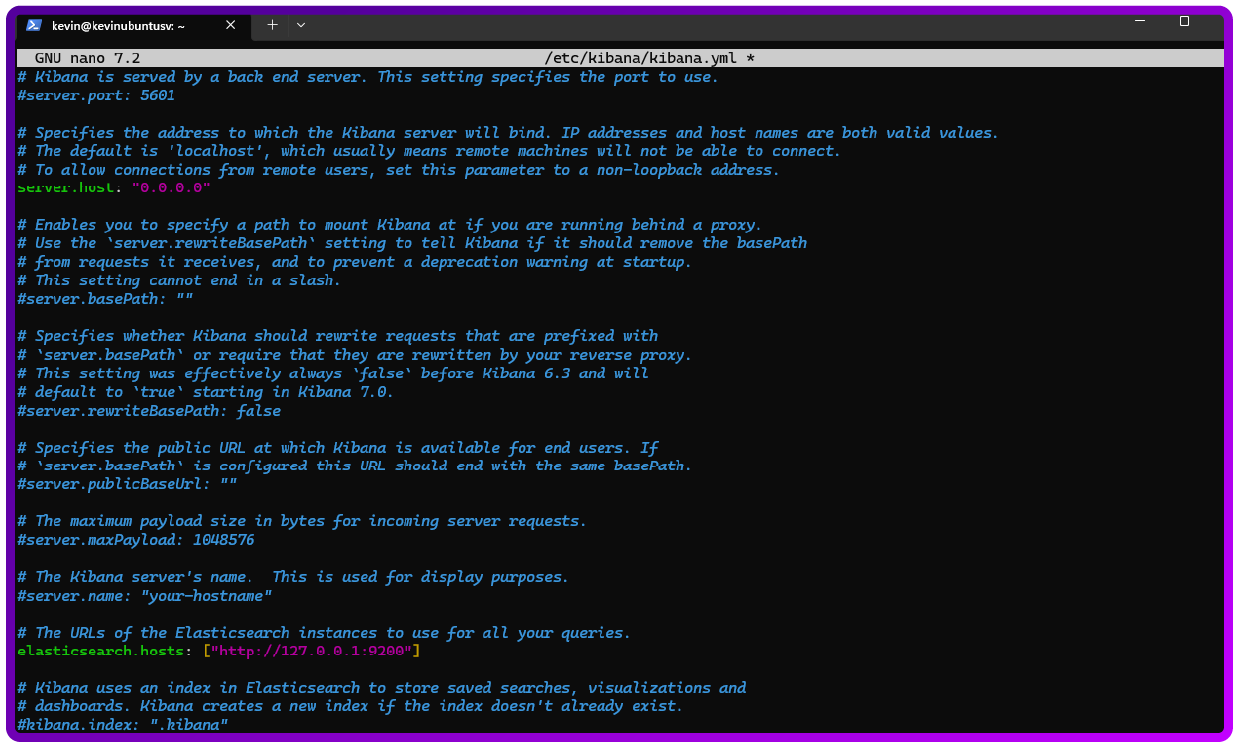
To Start and Enable kibana to start with the system:
sudo systemctl start kibana
sudo systemctl enable kibana
Now we can check that it’s working by accessing Kibana:
http://<server-ip>:5601

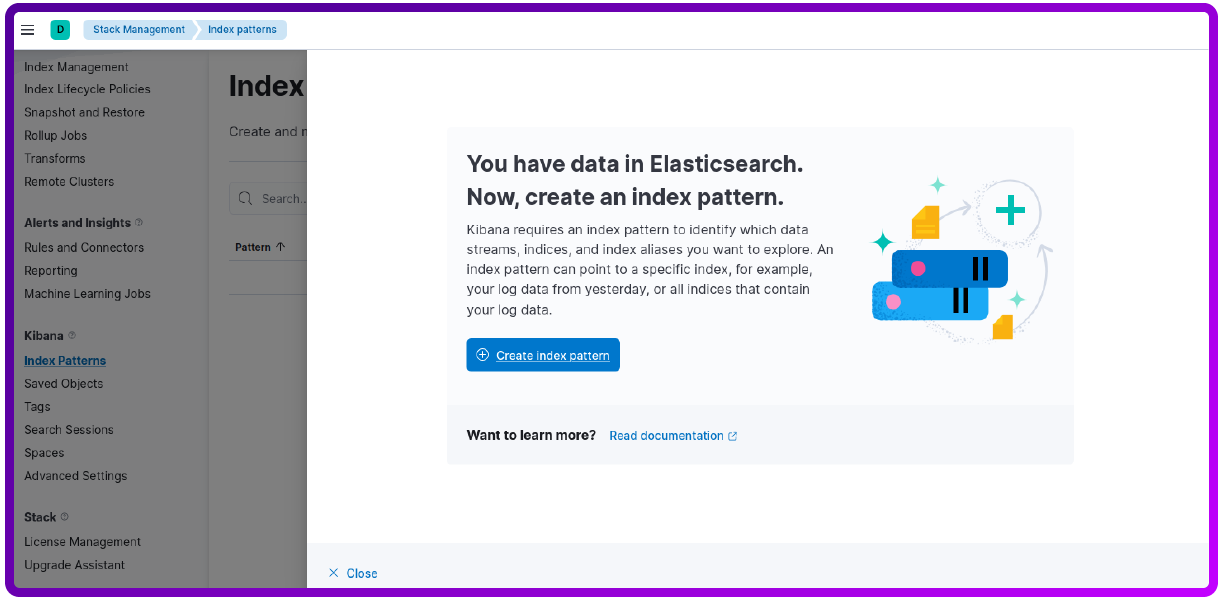
Now we need to Configure Elasticsearch Index in Kibana
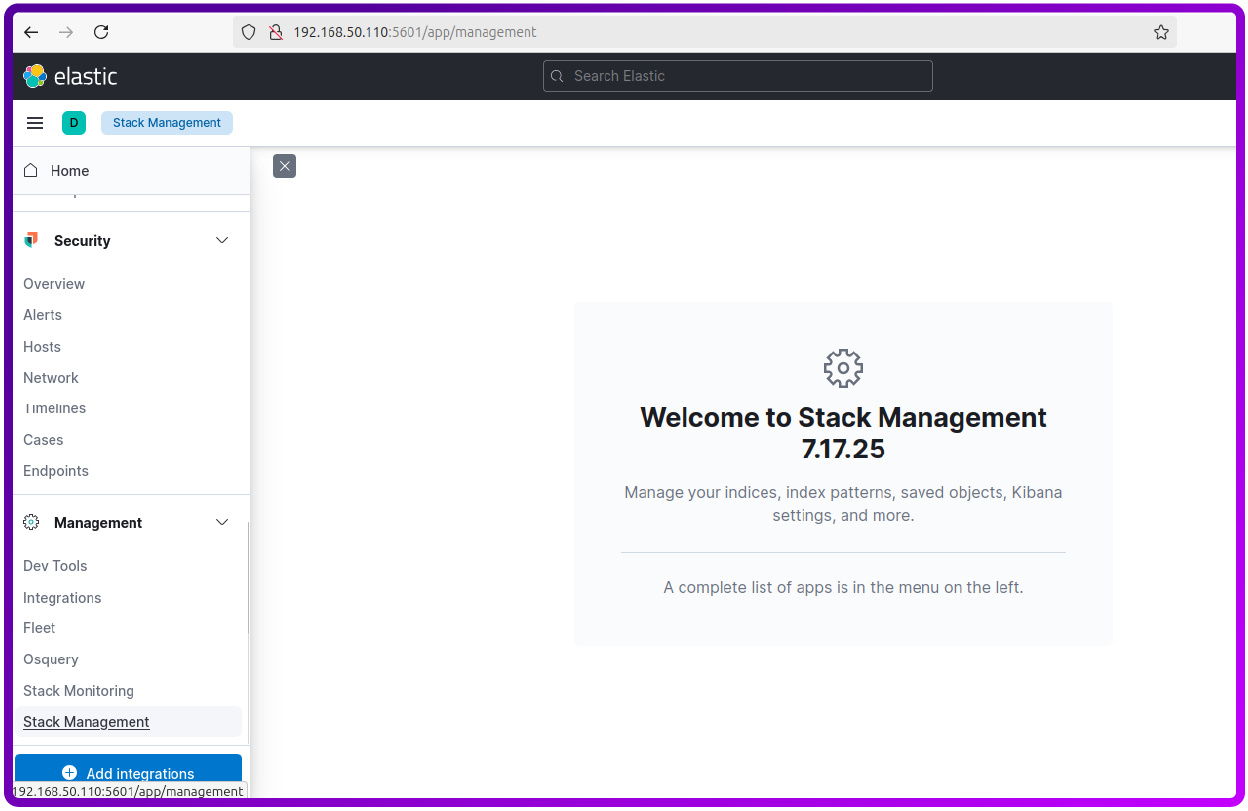
Select Index patterns:
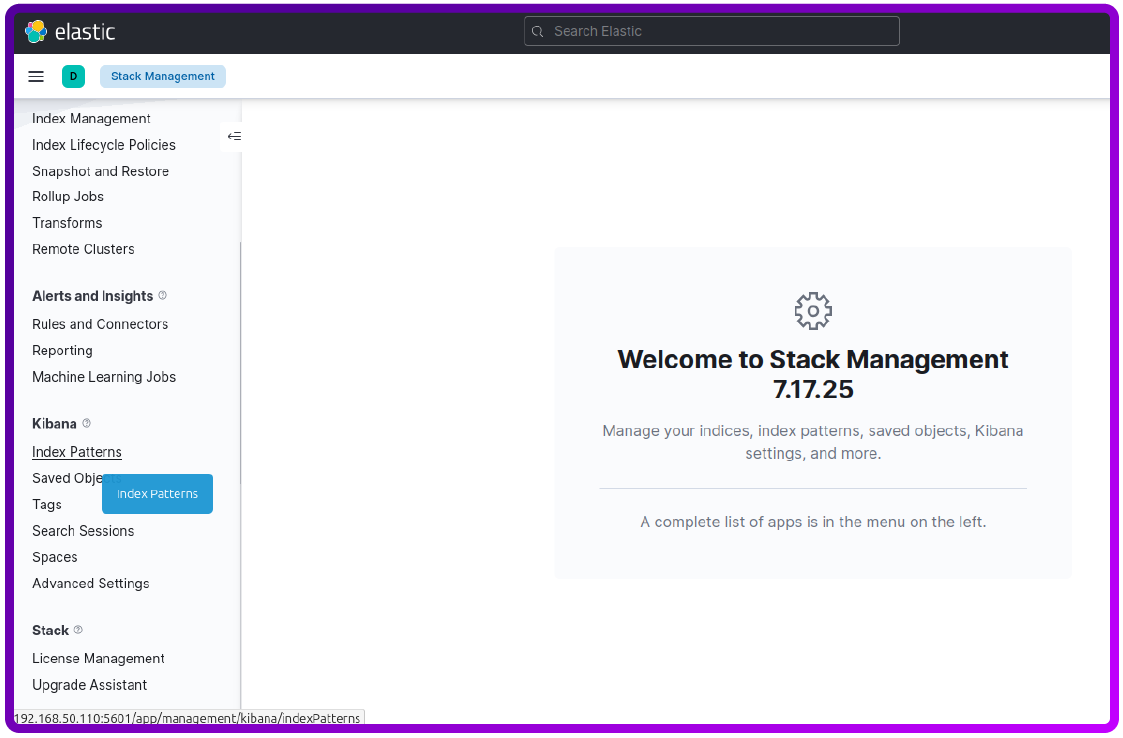
Now click on Create Index Pattern:
Now just set the name and Timestams field like below:
modsecurity-logs*
@timestamp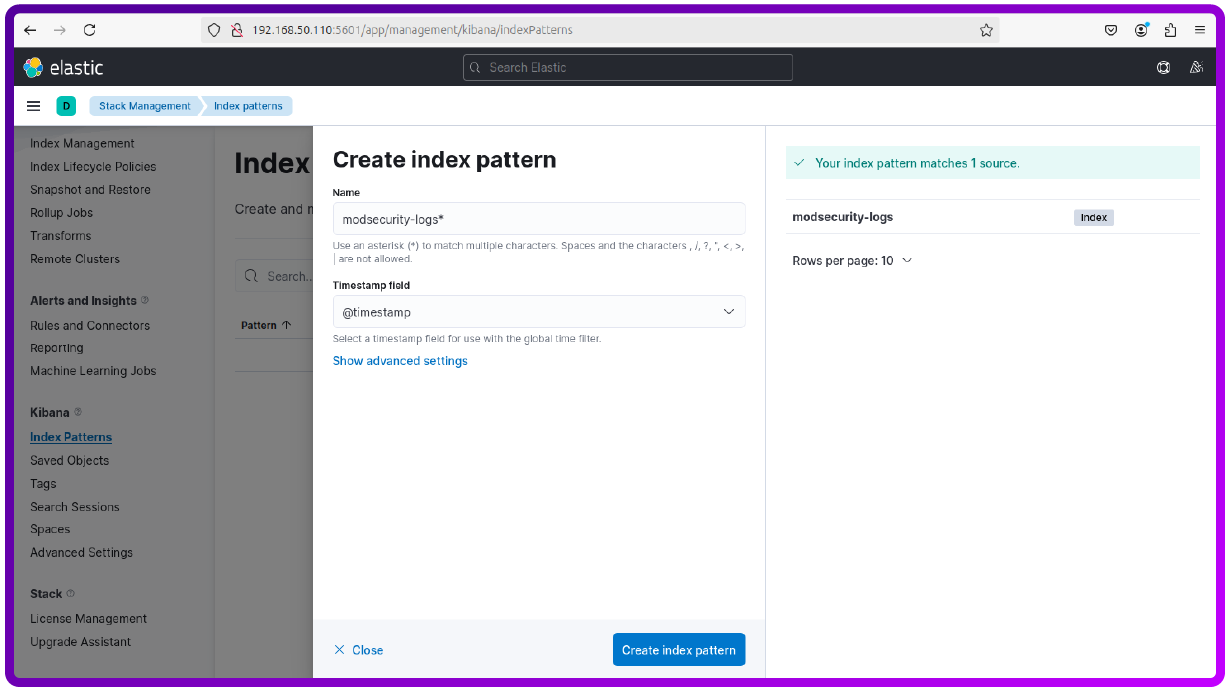
Now we can visualise the logs (by going to Discover and selecting modsecurity-logs*).
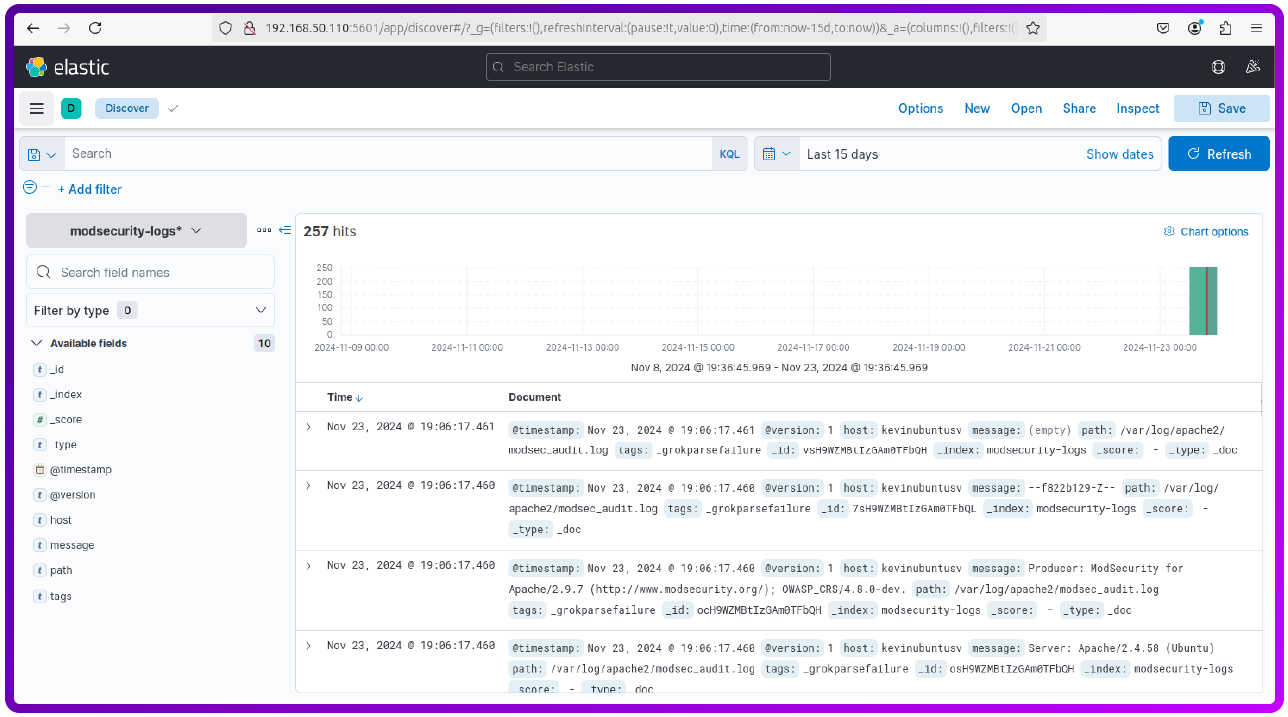
Visualize ModSecurity Logs via a Dashboard
1. Create a Dashboard:
- Navigate to Dashboard > Create New Dashboard.
2. Add Visualizations:
Use Visualize to create:
- Pie charts for blocked requests by rule ID.
- Line graphs for blocked request trends over time.
- Tables for top IP addresses generating blocked requests.
How to install and configure Graylog
Graylog requires a few components: MongoDB (to store configuration and metadata), Elasticsearch (for storing logs), and Graylog itself.
Prerequisites
Install Java (Graylog and Elasticsearch require Java):
sudo apt install openjdk-11-jre-headless -yNow let's install MongoDB version 4.4. In my environment, I didn't have the prerequisites such as AVX to install it natively, so I used Docker instead:
sudo apt install docker.io -y
sudo docker run -d -p 27017:27017 --name mongodb mongo:4.4
Verify that its installed it should look like below:
sudo docker psWhat this command does is show us that the docker is running the mongo image:

N.B. For future reference, to start the docker, use:
sudo docker start mongodbElasticsearch install
We will also need to install Elasticsearch:
wget -qO - https://artifacts.elastic.co/GPG-KEY-elasticsearch | sudo apt-key add -
sudo sh -c 'echo "deb https://artifacts.elastic.co/packages/7.x/apt stable main" > /etc/apt/sources.list.d/elastic-7.x.list'
sudo apt update
Let's install it:
sudo apt install elasticsearch -yLets start it and enable it to start with the system:
sudo systemctl start elasticsearch
sudo systemctl enable elasticsearch
Graylog install and configuration
Now let’s install Graylog.
Download the Graylog repository package:
wget https://packages.graylog2.org/repo/packages/graylog-4.3-repository_latest.debInstall the Graylog version 4.3 repository and update the local package database:
sudo dpkg -i graylog-4.3-repository_latest.deb
sudo apt update
Install Graylog:
sudo apt install graylog-server -yNow we need to generate a Secret and Admin Password Hash:
pwgen -N 1 -s 96
echo -n yourpassword | sha256sum
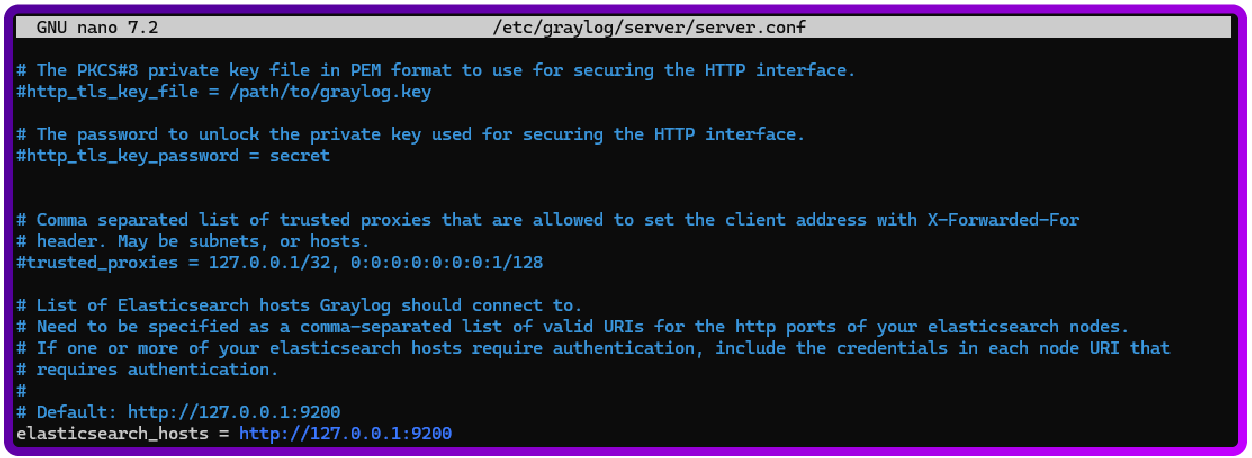
Integrate Graylog with Elasticsearch and Mongodb
And then we will need to add them to this config, and also configure graylog to use elasticsearch and mongodb:
sudo nano /etc/graylog/server/server.conf
elasticsearch_hosts = http://127.0.0.1:9200
mongodb_uri = mongodb://127.0.0.1:27017/graylog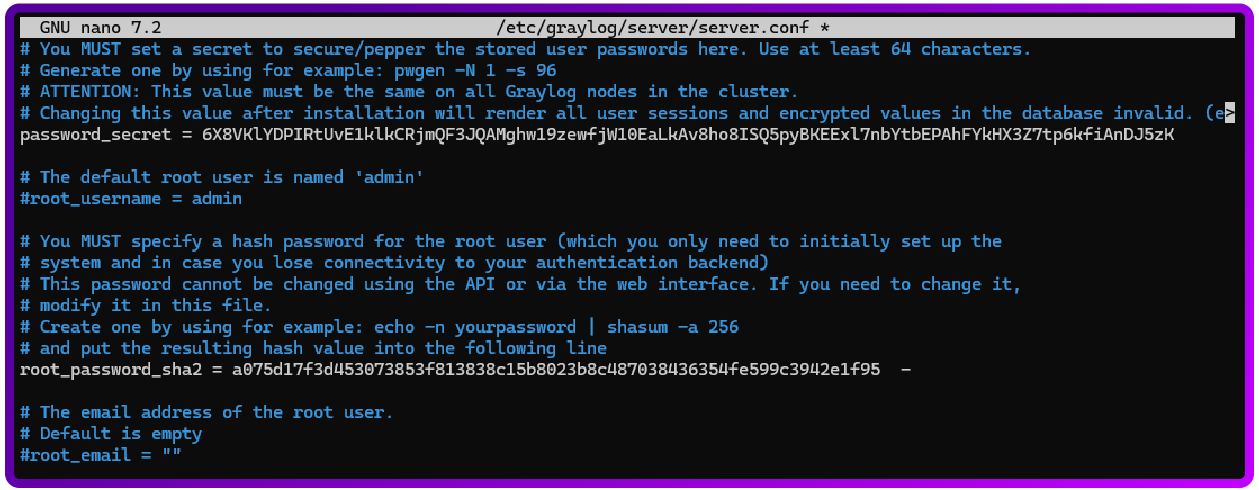

Right. Now we should be able to now access the web interface of graylog the username is admin and the password in plain text we’ve set in a previous step:
http://yourserverip:9000


Since we can access the web interface we now need to send the logs to Graylog from ModSecurity.
Edit the ModSecurity Configuration File to log in JSON format (Graylog reads JSON logs more efficiently).
sudo nano /etc/modsecurity/modsecurity.conf
SecAuditLogFormat JSON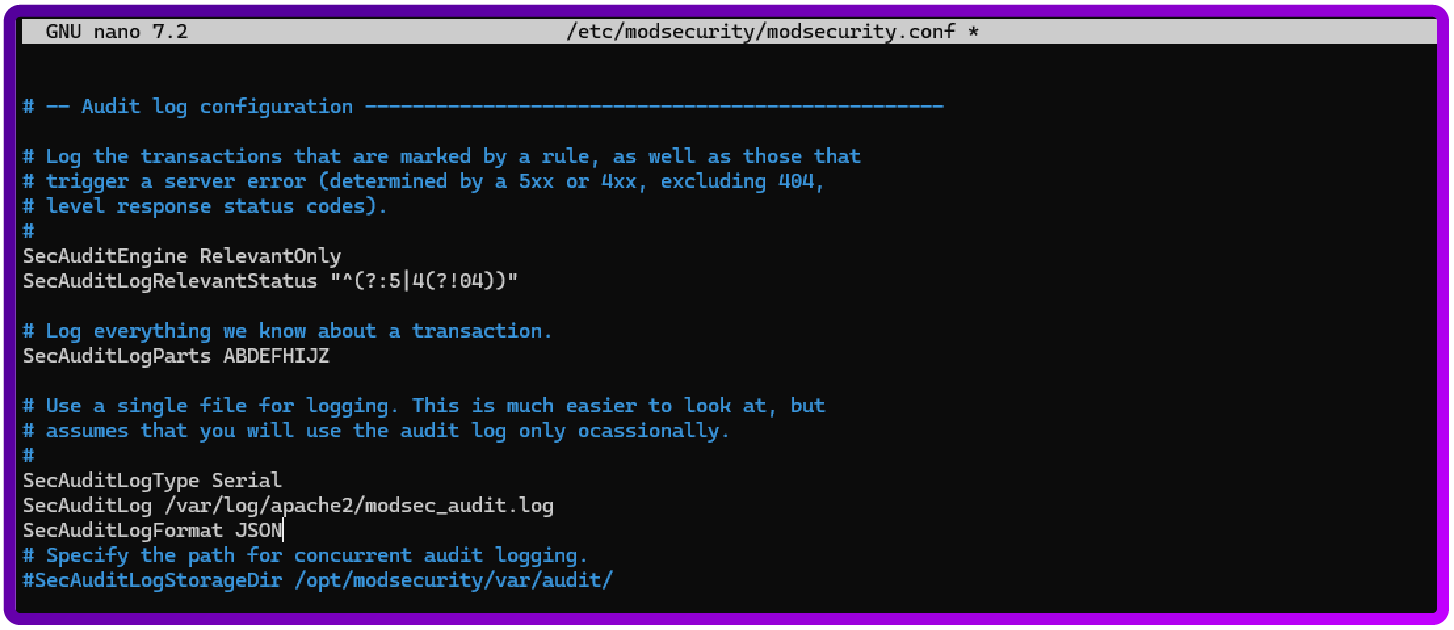
Restart apache2 to apply the changes
sudo systemctl restart apache2Filebeat log shipper
To send ModSecurity logs to Graylog, we’ll use Filebeat, which is a log shipper by Elastic:
sudo apt install filebeat -y
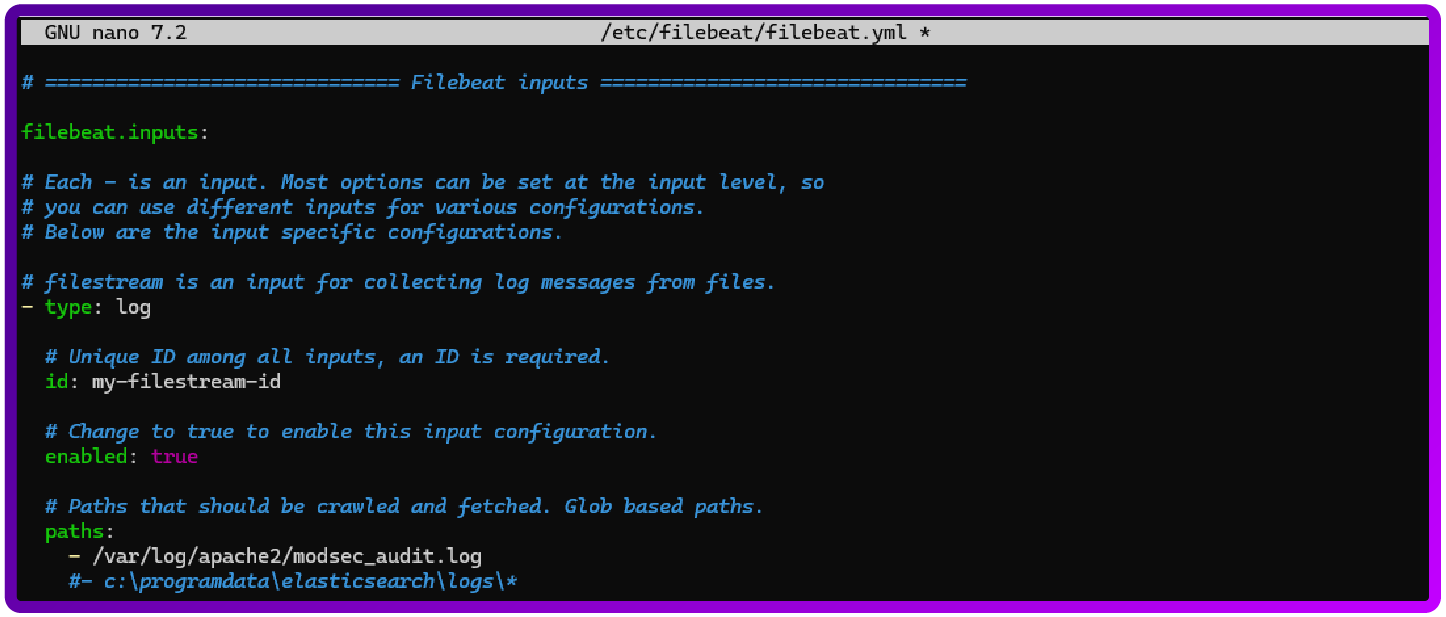
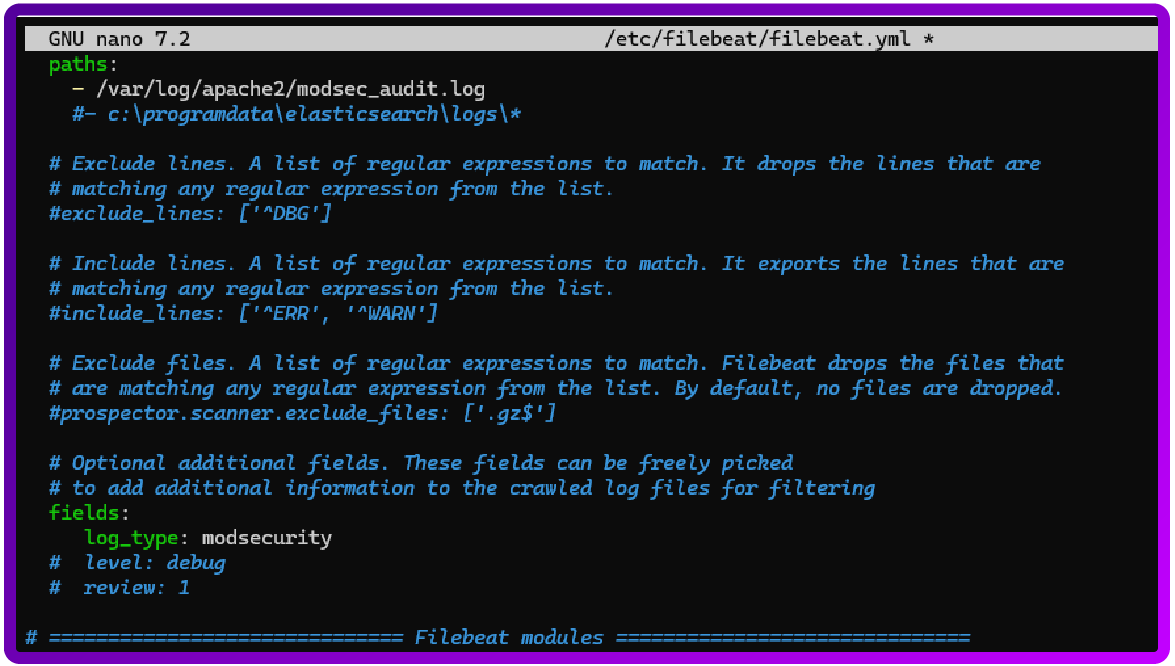
sudo nano /etc/filebeat/filebeat.yml
You will need to add the following:
filebeat.inputs:
  - type: log
    enabled: true
    paths:
      - /var/log/apache2/modsec_audit.log
    fields:
      log_type: modsecurity
Visualise logs in Graylog
Now we need to configure Graylog to Receive Logs from Filebeat.
Set Up a Beats Input in Graylog:
Go to the Graylog web interface (http://<your-server-ip>:9000).
Go to System > Inputs.

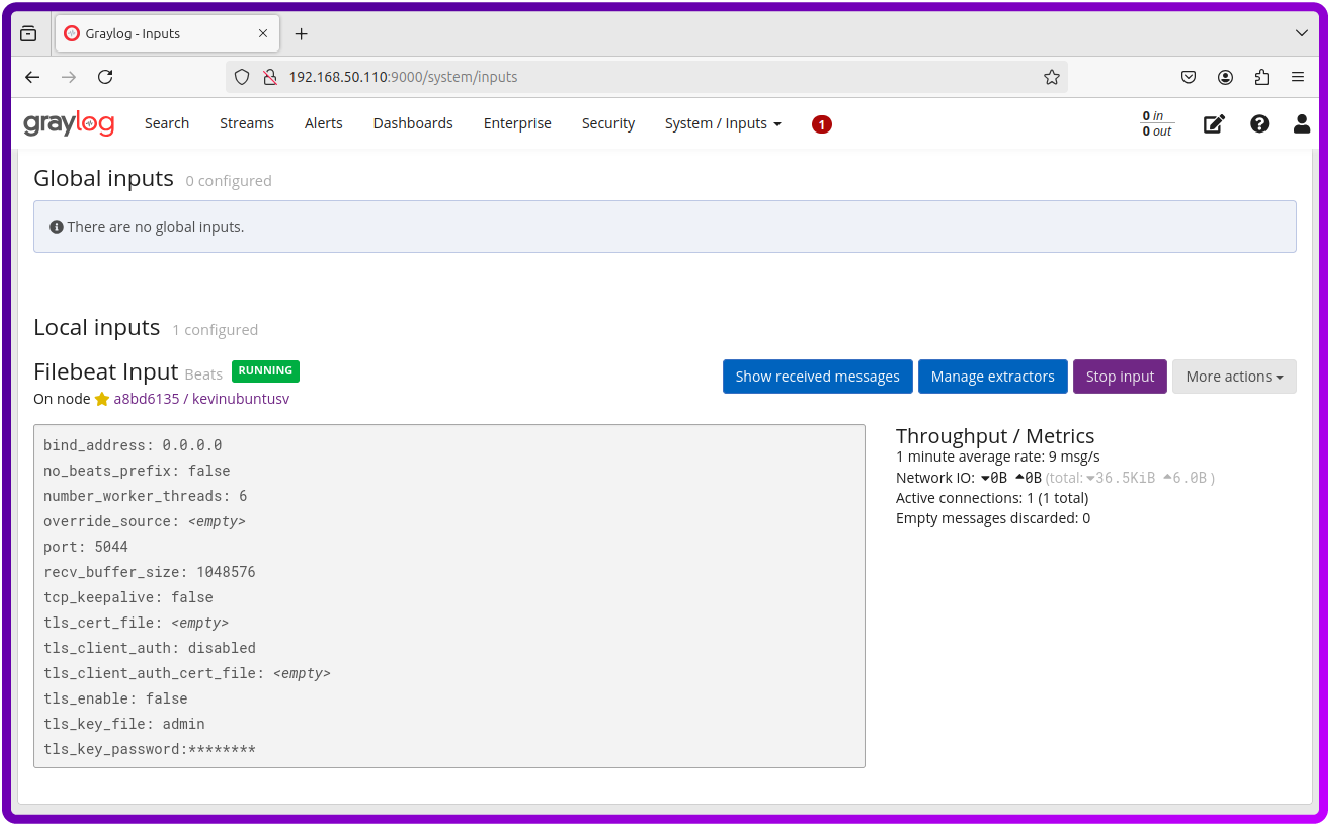
Select Beats from the dropdown and click Launch new input.
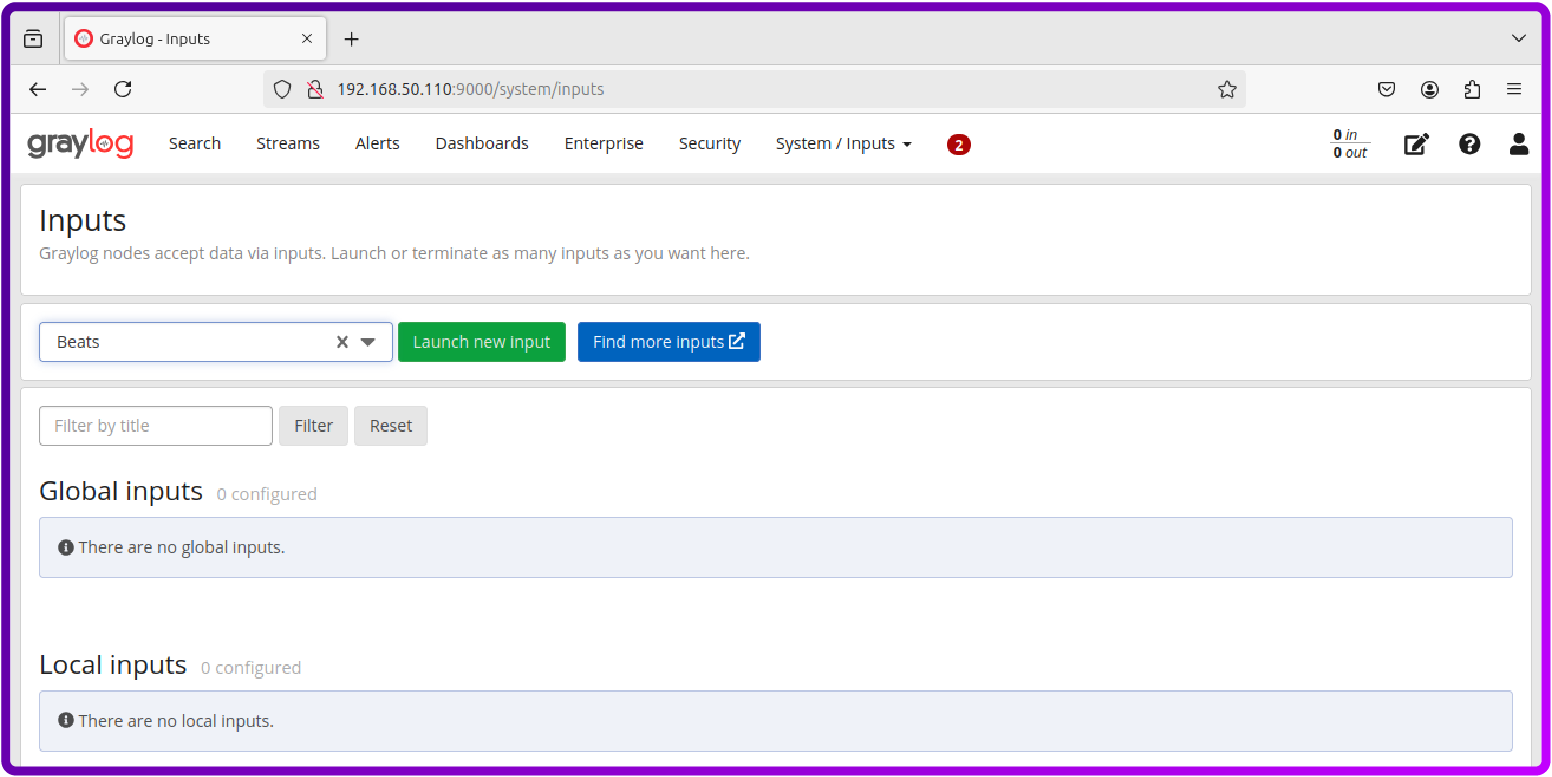
- Bind address: 0.0.0.0
- Port: 5044
- Title: Filebeat Input (or any name you prefer)
Click Save to start the Beats input.
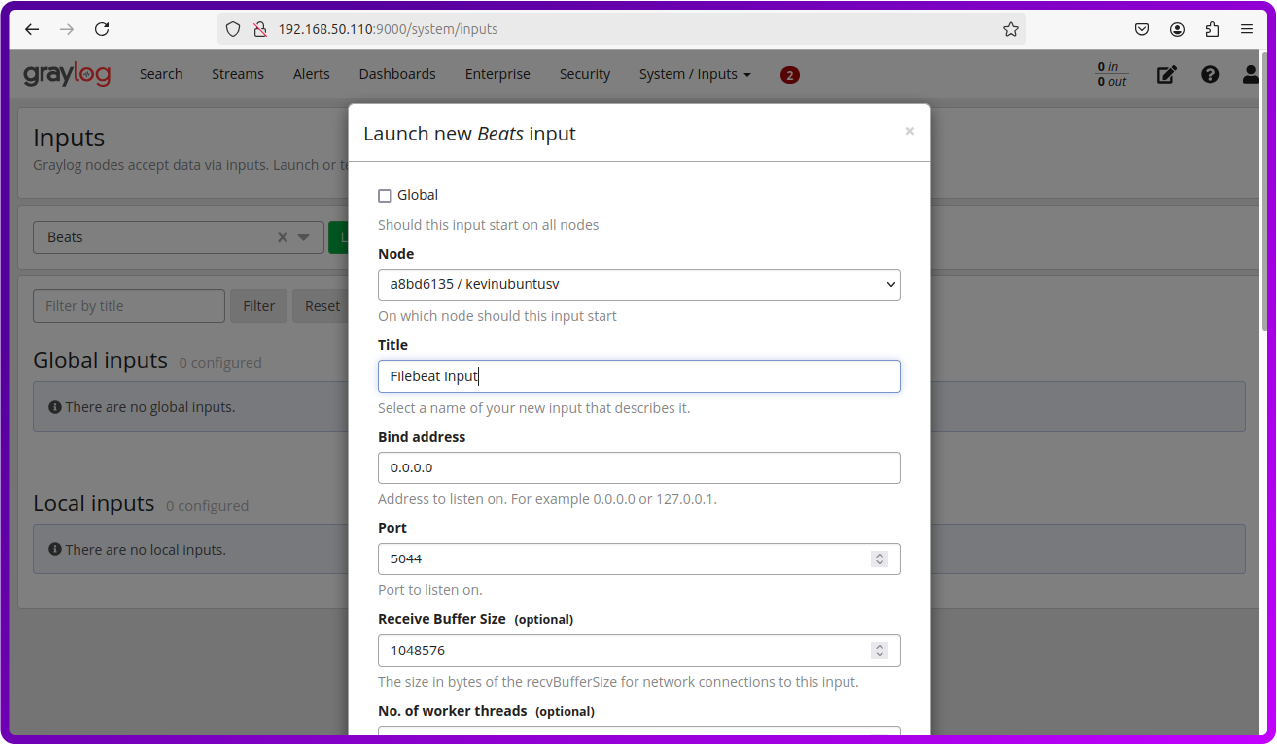
Here we can see that the input from filebeat is running:
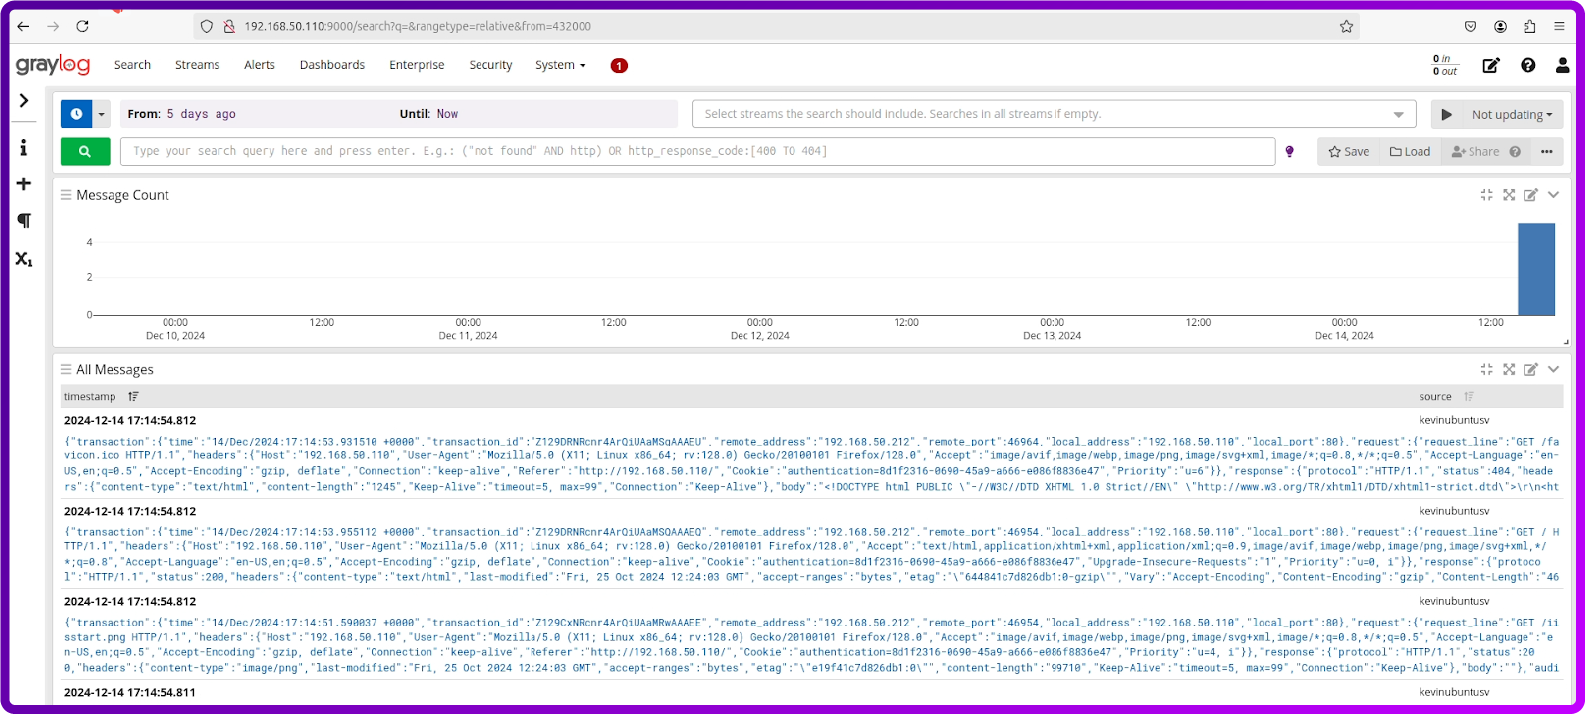
By heading over to the Search button we can see all the logs that are being saved:
How to install and configure Loki and Grafana
Update and install system prerequisites
sudo apt update && sudo apt upgrade -y
We need Docker in this case version 26.1.3:
sudo apt install docker.io -y
Loki and promtail
Loki is the log aggregation system we are going to be using. We will need to create a Loki directory and make it our current directory:
mkdir loki
cd loki
Download the Loki and promtail config files version 3.0.0:
wget https://raw.githubusercontent.com/grafana/loki/v3.0.0/cmd/loki/loki-local-config.yaml -O loki-config.yaml
wget https://raw.githubusercontent.com/grafana/loki/v3.0.0/clients/cmd/promtail/promtail-docker-config.yaml -O promtail-config.yaml
You will need to edit the promtail-config.yaml file and under job: add modsecurity also under __path__ .
You will need to add : /var/log/apache2/modsec_audit.log (like below, you will need to be in the Loki folder where the files are saved):
sudo nano promtail-config.yaml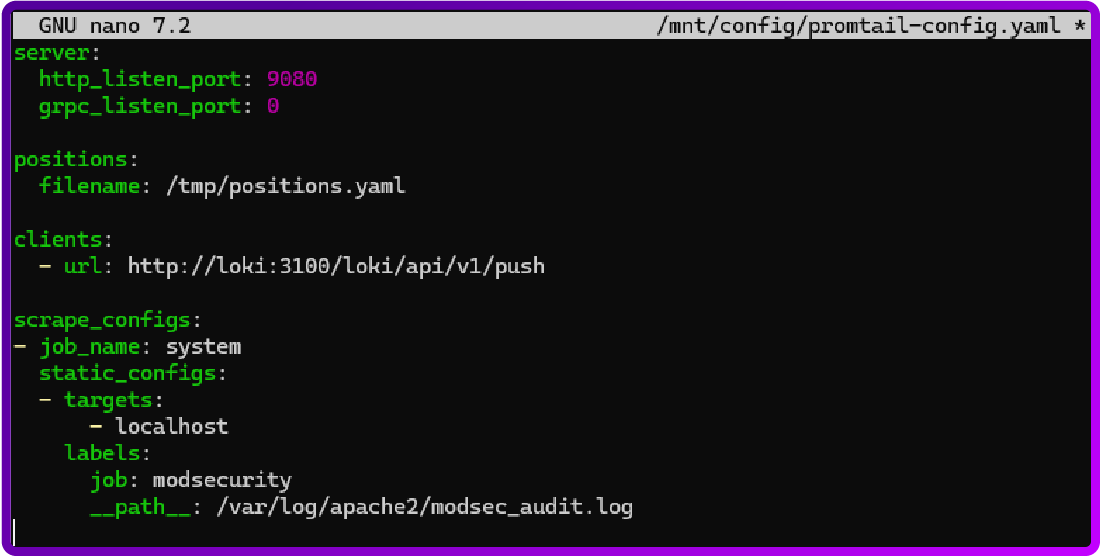
Now to download and run loki and promtail version 3.2.1:
sudo docker run --name loki -d -v $(pwd):/mnt/config -p 3100:3100 grafana/loki:3.2.1 -config.file=/mnt/config/loki-config.yaml
sudo docker run --name promtail -d -v $(pwd):/mnt/config -v /var/log:/var/log --link loki grafana/promtail:3.2.1 -config.file=/mnt/config/promtail-config.yaml
To check that they are running use:
sudo docker container lsIt should look like this:

Install Grafana
Now to install grafana, the latest version, which currently is 11.3:
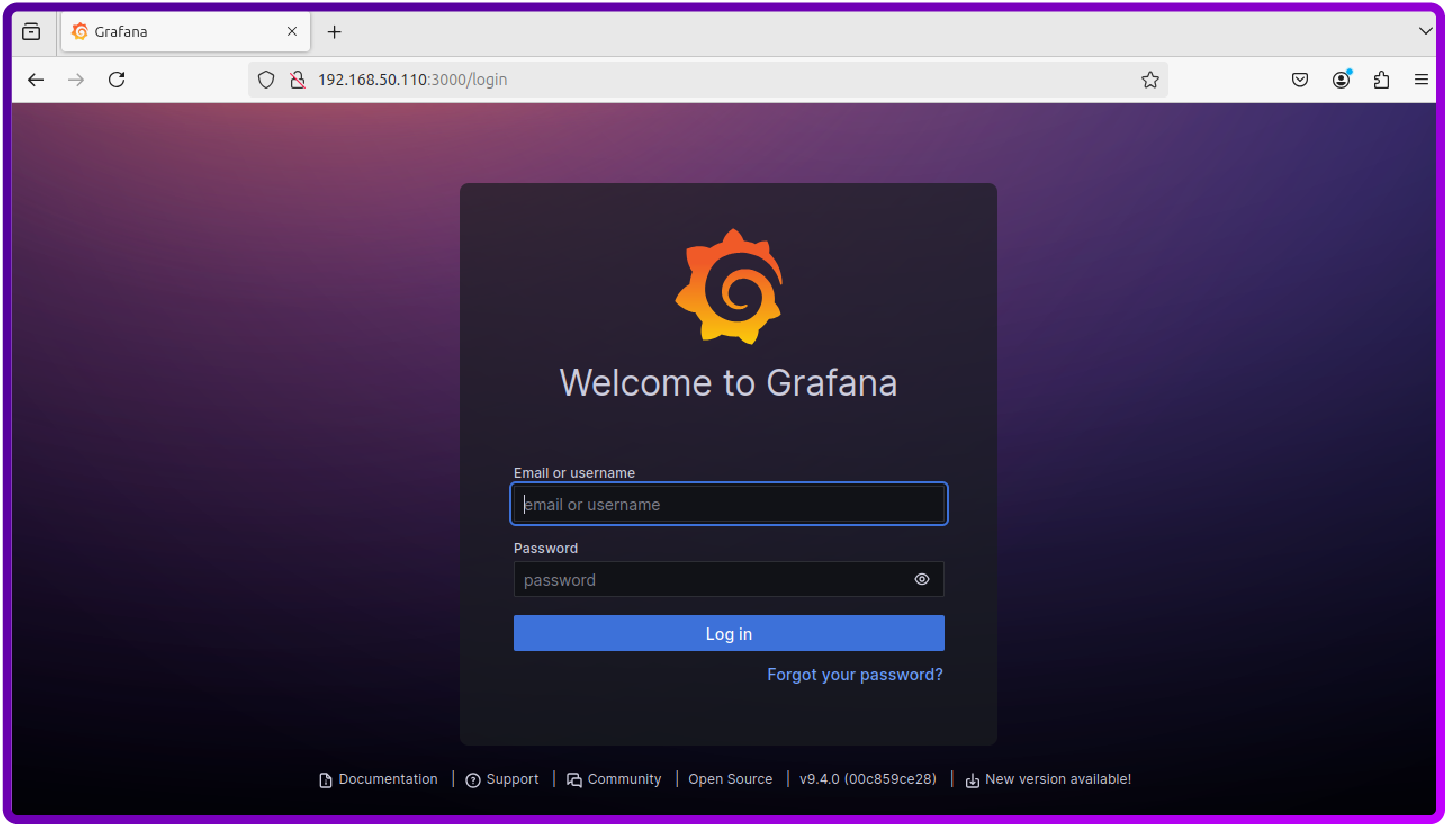
sudo docker run -d -p 3000:3000 --name=grafana grafana/grafana-enterpriseAccess Grafana at:
http://<your-server-ip>:3000
Default username and password are: admin (you will be prompted to change it on first login)
Loki integration with Grafana
To add Loki we need to head over to Connections > Data sources
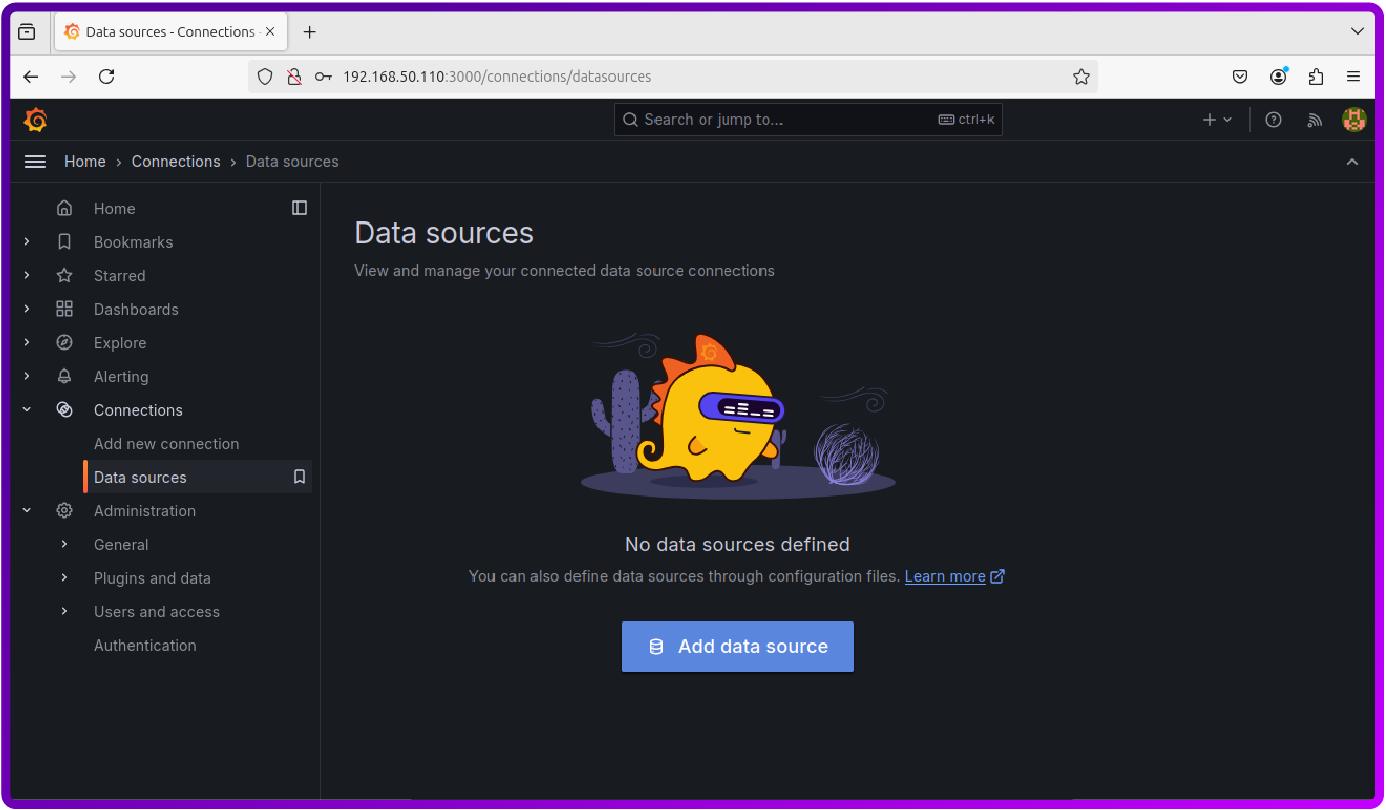
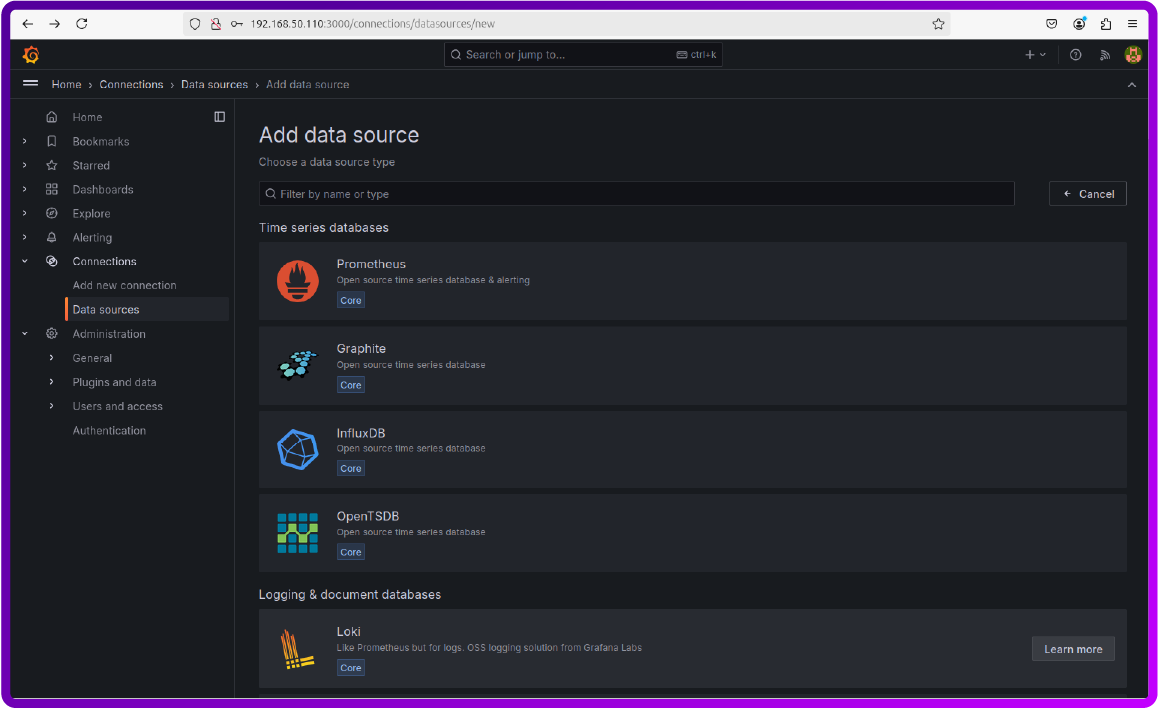
Here in the Logging & document databases we can see Loki, just click on it.
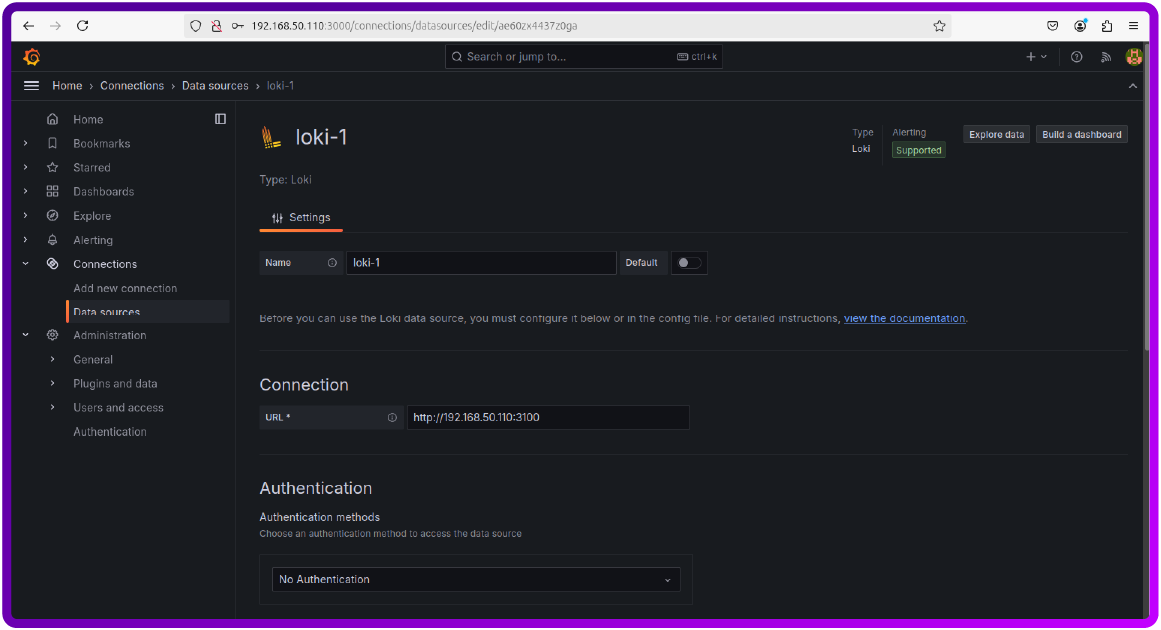
Once you add it you just need to add the IP where the Loki is saved.
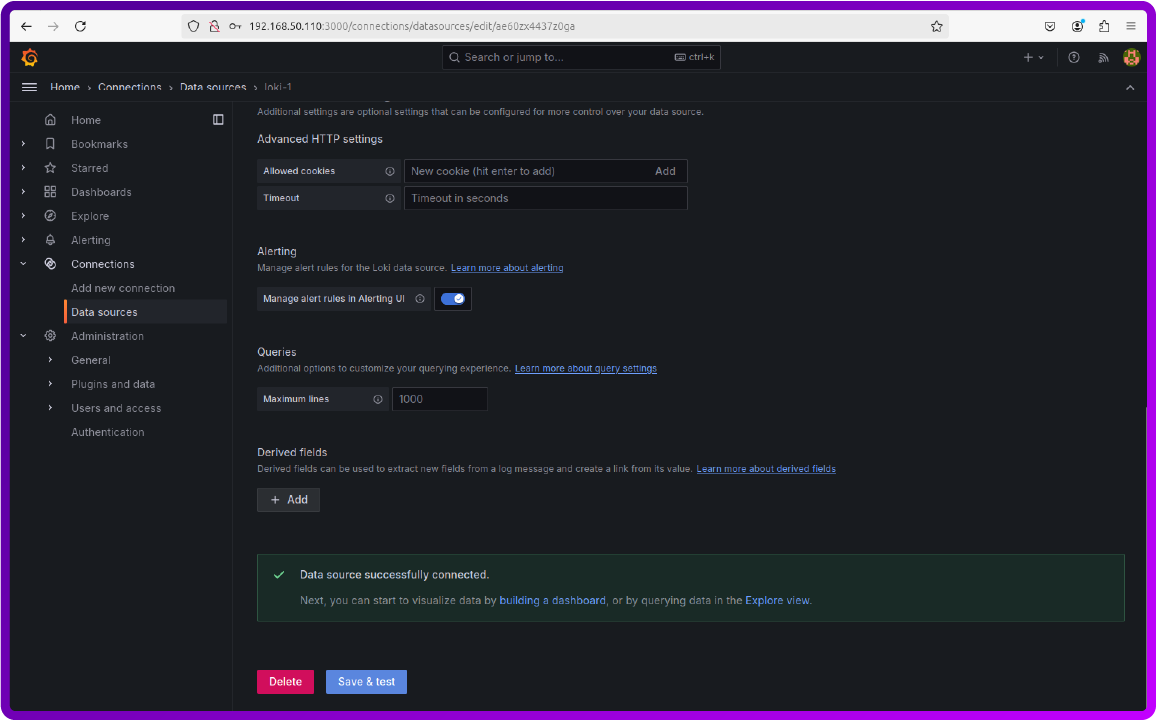
You can now scroll down and click save and you should see that the Data source is successfully connected.
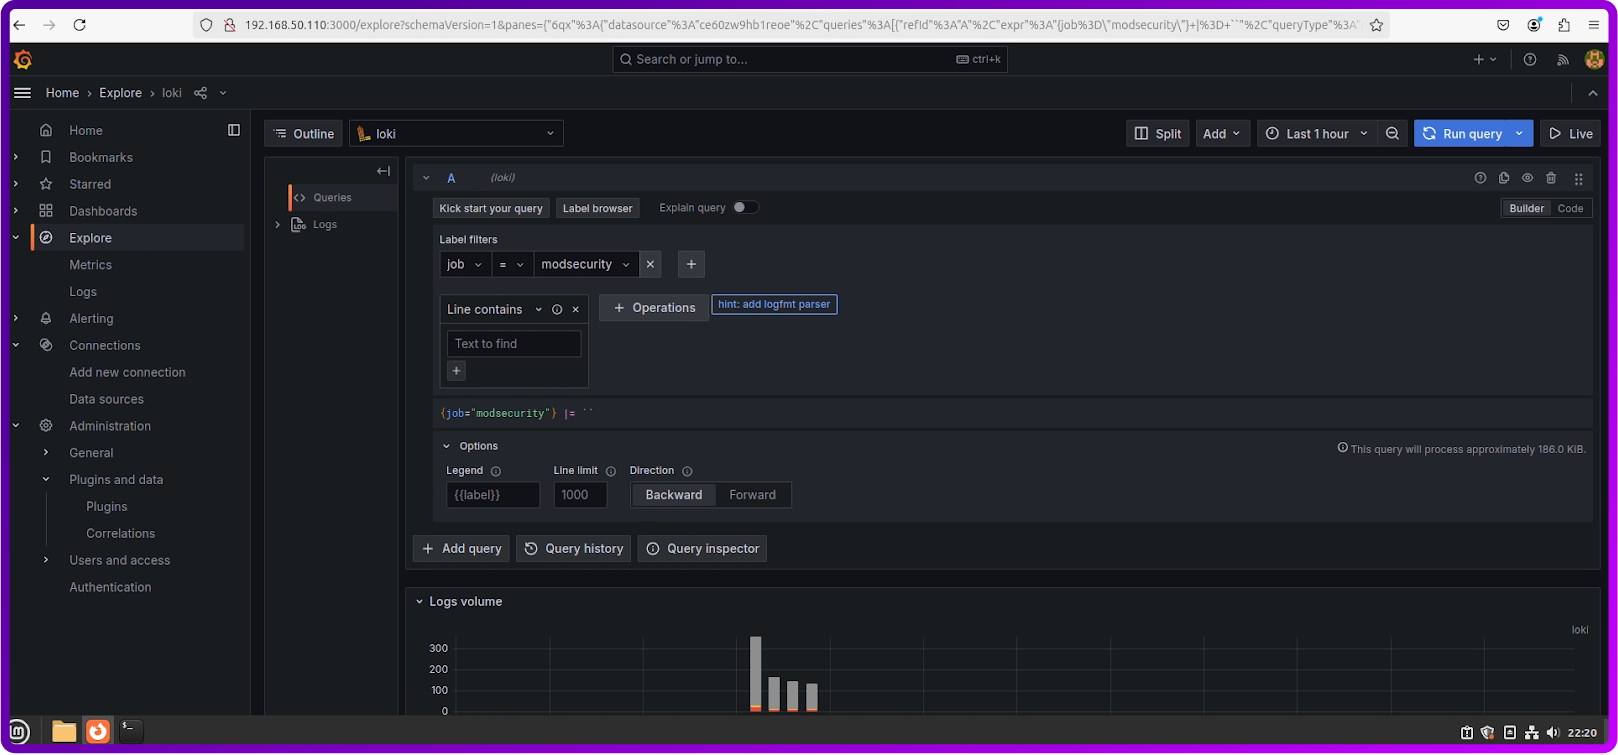
In order to visualize the logs you can head over to the Explore section and under the Label filters select job = modsecurity and then below you should be able to see the logs.
Detecting security issues with ModSecurity
Once you have trained your WAF you can have a look at how we can see for each logging tool a security issue.
We are going to use the following command which simulates a SQL attack on the website:
curl -X GET "http://<your-web-server-ip>/index.php?id=1' OR '1'='1" -H "User-Agent: SQLInjectionTest"- Replace <your-web-server-ip> with the IP or domain of your web server.
- The User-Agent: SQLInjectionTest header helps you easily identify the request in the logs.
This command sends a GET request with an SQL injection payload (id=1' OR '1'='1) to the specified URL. The request is logged by ModSecurity.
How to detect security issues with the ELK stack
- Run the curl command to simulate the SQL injection.
- Open Kibana and navigate to the Discover section.
- In the search bar at the top, enter:
SQLInjectionTestThis filters the logs to show the request.
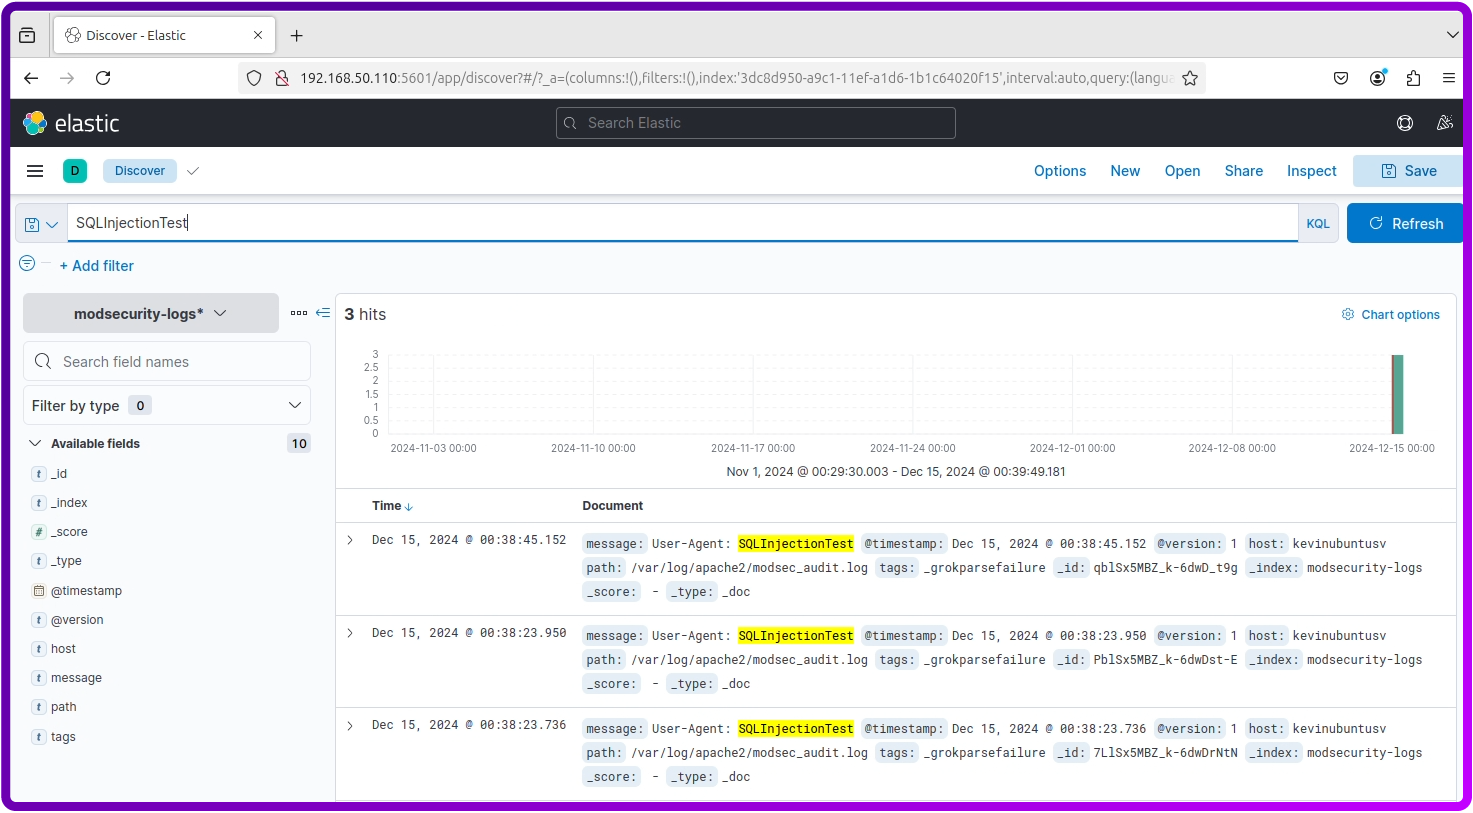
- Review the log entry to see details such as:
- The source IP address.
- The exact timestamp of the event.
- The malicious request and its payload.
- Any matching ModSecurity rules that flagged the attack.
- Additional HTTP metadata like the method, headers, and URL.
With Kibana’s visualization tools, you can take this further by creating dashboards or alerts to track repeated SQL injection attempts or suspicious activities over time.
How to detect security issues with Graylog
- Run the curl command to send the SQL injection request. From HERE
- Access the Graylog web interface (e.g., http://<your-server-ip>:9000).
- Navigate to the Search section.
- In the search bar, enter:
SQLInjectionTestThis will display all logs containing the SQLInjectionTest header.

- Examine the log entry to see details such as:
- The source IP address.
- The exact timestamp of the event.
- The malicious request and its payload.
- Any matching ModSecurity rules that flagged the attack.
- Additional HTTP metadata like the method, headers, and URL.
Graylog also allows you to create alerts that notify you of repeated attacks or any high-severity security violations.
How to detect security issues with Loki and Grafana
- Run the curl command to send the SQL injection request.
- Open Grafana and go to the Explore section.
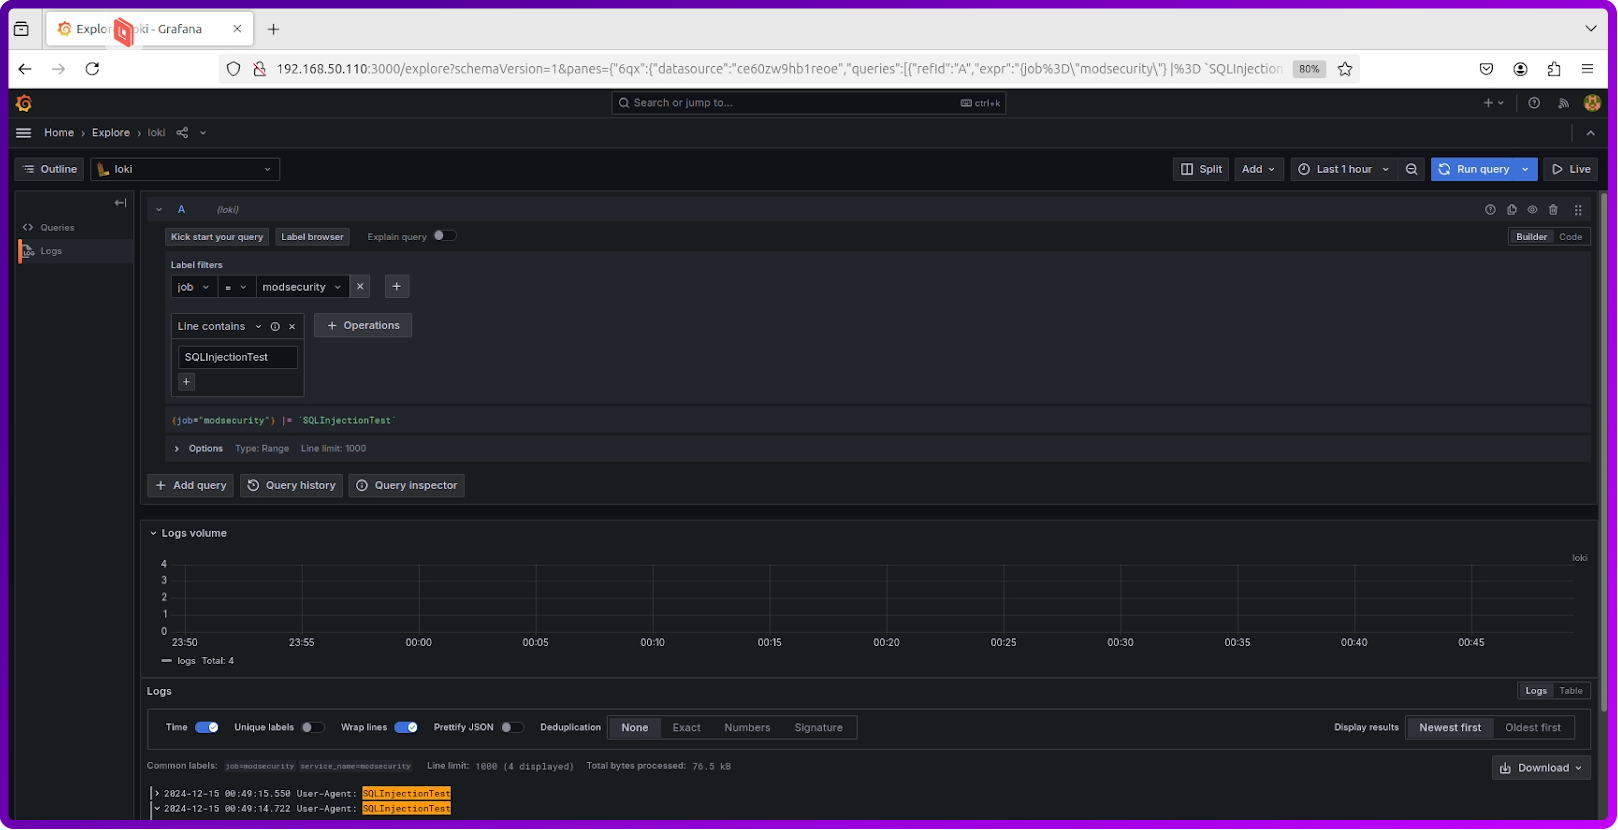
- Under Loki Data Source, filter the logs with the following query:
{job="modsecurity"} |= "SQLInjectionTest"This query looks for all logs from the modsecurity job containing the string SQLInjectionTest.
As we can see from the screenshot below the logs have been selected.
You can visualize them in the context of the full logs by clicking on the Show context on the right like below:

And here it is in full context of the logs:
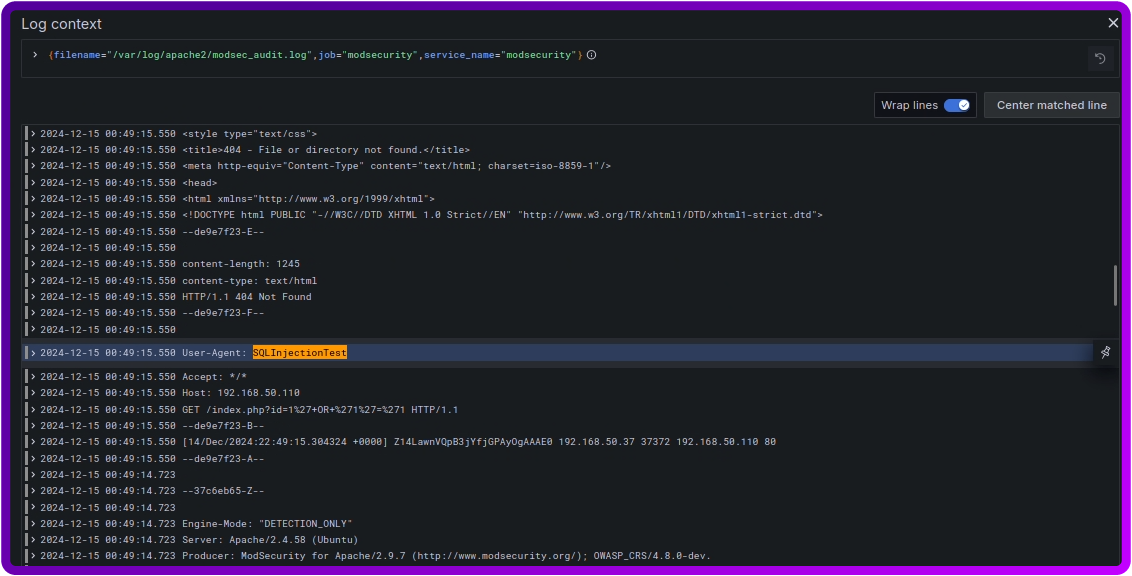
- Review the log entry and its details, such as:
- The source IP address.
- The exact timestamp of the event.
- The malicious request and its payload.
- Any matching ModSecurity rules that flagged the attack.
- Additional HTTP metadata like the method, headers, and URL.
Using Grafana, you can create custom dashboards that visualize attack trends or correlate them with other system metrics like CPU usage or network activity.
Summary
In this blog, we explored how to set up a comprehensive logging and monitoring solution for ModSecurity and HAProxy using three powerful open-source tools: Graylog, the ELK Stack, and Loki + Grafana. By leveraging these tools, we demonstrated how you can efficiently capture, analyze, and visualize logs to enhance the security and performance of your infrastructure.
We began by understanding the critical role of monitoring logs, especially in a web application environment where ModSecurity and HAProxy are used for securing and optimizing traffic. We then delved into the step-by-step process of setting up each tool, configuring them to collect logs from ModSecurity, and making the most of their unique features.
Key takeaways from this journey:
- ELK Stack: Provides a flexible and visually rich logging framework that integrates Elasticsearch, Logstash, and Kibana for analyzing and visualizing security alerts.
- Graylog: Offers a centralized log management solution with powerful search and alerting capabilities, perfect for real-time monitoring of ModSecurity logs.
- Loki + Grafana: A lightweight and efficient log aggregation and visualization solution, ideal for modern containerized environments where simplicity and performance are priorities.
We also demonstrated how these tools can detect security issues by simulating a common attack, such as SQL injection, and showed how the logs can provide actionable insights to identify and address vulnerabilities.
Why it matters
Logs are more than just data—they are insights into your application’s behavior and your infrastructure’s security. By implementing robust logging and monitoring practices, you can proactively detect threats, troubleshoot issues, and optimize performance. These open-source tools make it accessible and cost-effective for organizations of all sizes to achieve this.
Final thoughts
With Graylog, the ELK Stack, and Loki + Grafana, you have a versatile set of tools to monitor, analyze, and secure your systems effectively.
By following the steps outlined in this blog, you can create a powerful monitoring stack tailored to your needs, ensuring the stability, security, and efficiency of your web applications.
Remember, logs are your first line of defense. Start monitoring today and make your infrastructure more resilient against threats!


